Building a Paid Search Demand and Supply Model
Building a Paid Search Demand and Supply Model
Case Study: The AA & WeDiscover

Share
Over the past 2 years, we have been working on our most ambitious paid search project to date.
In this article, we go through how we created a ‘holy grail’ solution in performance marketing: matching demand and supply at scale, all completely automated.
Context
The AA is a leading driving brand, that gives confidence to UK drivers. With everything from breakdown cover and insurance to car maintenance and even learning how to drive, they’ve got you covered.
The AA’s Driving School makes learning to drive easy for students. They help students from their first lesson to getting their driving license. They also work with instructors from all over the UK. These instructors partner with The AA to teach in their areas. This setup ensures high-quality instruction and convenience for learners.
In this business model, The AA’s Driving School objective is to expand its instructor franchise network by ensuring that they have the right infrastructure and environment to succeed (which includes benefiting from The AA’s reputation and online presence by recruiting customers i.e. students).
Historically the Driving School had found one of the main reasons for instructors not renewing their franchises was a lack of pupils being sent their way.
This triggered our project together: Themis. The AA’s smart student acquisition automation project, a self-contained demand and supply tool that manages hyperlocal paid search activity based on teacher availability.
The challenge: how to balance localised spikes in supply within paid acquisition
The AA Driving School has a dense network of instructors around the UK. Keeping them busy and fulfilled with work is necessary to ensure they choose to maintain their contracts with The AA.
Given the business doesn’t directly generate revenue for each student acquired, it was often difficult for The AA to assign paid acquisition budget and decide how it should be best utilised.
Furthermore, to make paid acquisition activity work for The AA, it is necessary to acquire students in areas where there is a teacher available to service that student. That sounds simple enough, right? Let’s add some caveats:
-
- Instructors can service multiple postcode districts, and they have the flexibility to make changes to their servicing areas at any time in their AA’s instructor portal. How then do we ensure that we target all areas the instructors cover on paid channels?
-
- Instructors can at any notice change their “student cap”; an indicator of how many students The AA can send to the instructor. For example, by reducing their student cap an instructor may effectively give themselves a part-time workload. How do we create a system that reflects these changes in the overall acquisition strategy?
-
- Student demand is seasonal, with a spike in summer. This results in the majority of instructors being busy at that time, reducing the supply gap. How can we calculate instructor’s need for new pupils at a given time?
-
- Google Ads is well geared towards e-commerce style business but there is not yet an in-built way to share a feed that takes account of multiple considerations impacting supply/demand. How then, can we best leverage Google Ads’ capabilities to tie in with our model?
-
- We need to identify students with the greatest need for instructors, whilst balancing this with the fact that profit to The AA diminishes as instructors’ need for pupils decreases. How can we ensure that paid acquisition only supports instructors in need of new pupils?
All of these caveats made this process very challenging, taking us 2 years of development, testing, and iteration to ultimately achieve a solution that we are extremely proud of.
So here’s how we did it.
Finding the right Google Ads structure: test, test, test
Finding the optimum structure was one of the most challenging parts of the entire process.
Over the past few years, Google has been consistently developing its algorithms and increasingly pushing advertisers to lean into the power of automation which, when well utilised, can yield great results. Google can only work with the data that it has, and in this situation, it was missing crucial business context.
What we needed was a feed-like setup but, rather than that including many different products (e.g. shoes, tops, shirts), we just have many entities of one core product (instructors), though with each having constantly shifting availability based on a number of factors.
Without the ability to share all of those factors with Google, we would not be able to lean into its machine learning capabilities, as it would not have the necessary information to optimise activity effectively: even with an enormous amount of historical data, Google would not be able to adjust for ever-changing goal posts, with both pupil and instructor need rapidly changing.
But could we create a single campaign and control inventory using location bid modifiers?
To test this, we went all in with a thorough experiment. We created an automated model with in-built calculations to set bids for each location, calculating the instructor’s need for pupils as well as the expected uplift in traffic for each location at any given CPC, in order to ascertain the optimum bid at every location, and therefore the optimum bid modifier.
The idea was to create our own “maximise conversions” type system: a personalised bid strategy that took account of supply and demand, trying to push up to a given budget, prioritising the cheapest available conversions.
Well, we tried. Unfortunately even when changing location bid modifiers, in an attempt to better align inventory with Google’s optimisation efforts, we still had limited control over how much Google was spending in each location. We found in this instance that even with a -80% negative location modifier, Google still favoured high-volume regions.
So, we had to pivot with our approach.
Rather than leaning into modern search structures and heavy consolidation, based on our findings we had to create something bespoke here, as without becoming more granular we would be unable to give Google the insights it needed.
After many more proposals, tests, analyses, and further iterations, we ultimately landed on the following structure:
-
- One campaign per postcode district
- Maximise click bid strategies, with max. CPC limits set
- Strict budget caps for each campaign
- Very similarly templated ad groups, keywords, ad copy, and landing pages across all campaigns in the account
As a result of this set up we had a highly granular campaign structure that we could take advantage of to also create highly localised and relevant ad copy.
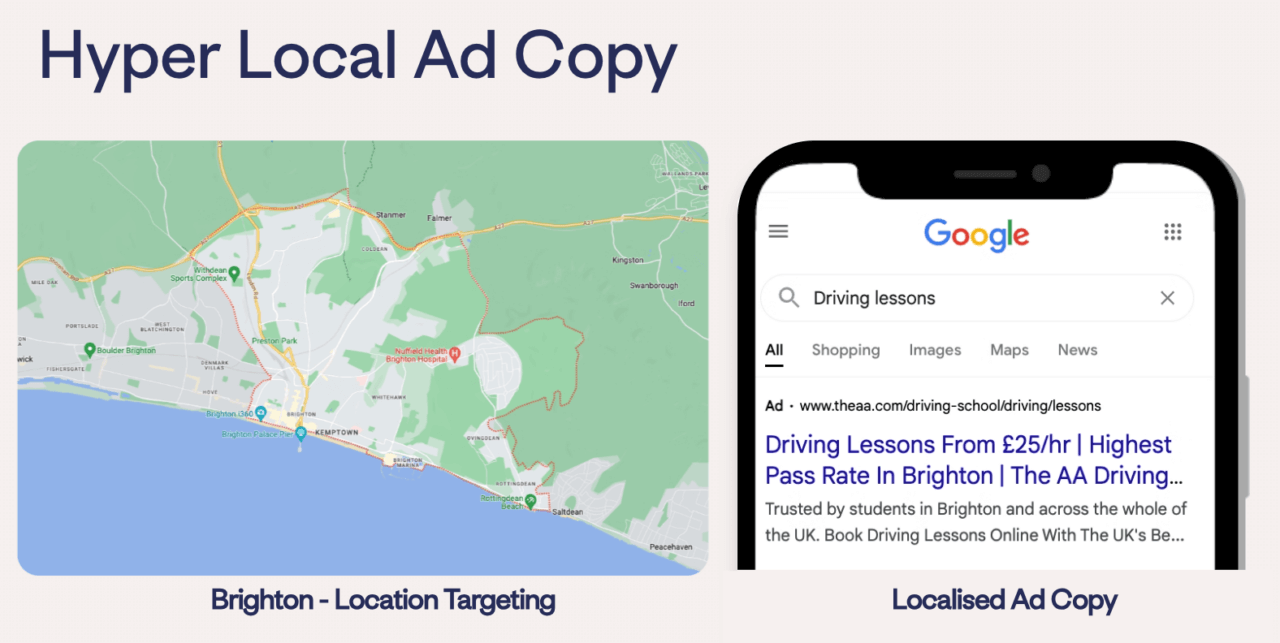
With a campaign per location, we now had tight control over budget allocation.
We also shifted our goals: rather than trying to obtain the most efficient conversions, we were trying to get as many conversions as possible for a given location, within set budget and max. CPC constraints.
Introducing Project Themis

So, how did we create this structure?
Creating a system to automatically manage the account wasn’t trivial. Especially because what we wanted was a hands-off system: an automated setup that could run activity with just a few inputs as levers.
This system had to:
-
- Ingest instructor availability and location in near real-time
- Calculate instructor need based on their current workload
- Calculate regional CPC limits needed based on past CVR/performance
- Distribute budget across locations based on the number of new students needed and the likelihood of acquiring them
- Integrate final budgets and targets for each campaign through the Google Ads API
- Analyse and take into account historical performance
- Have in-built alerting for any system failures or unexpected issues, and for identifying if daily settings for each modifier lie outside normal ranges
Some of these steps required straightforward data engineering solutions such as creating pipelines and automating the data flow needed to be able to run calculations, while some required novel approaches.
Calculating the Instructor Need score
This is a score that allows us to quantify the relative level of need a given driving instructor has for new pupils. In other words; how busy is the instructor, and how much value will we get from supplying them with pupils vs other instructors?
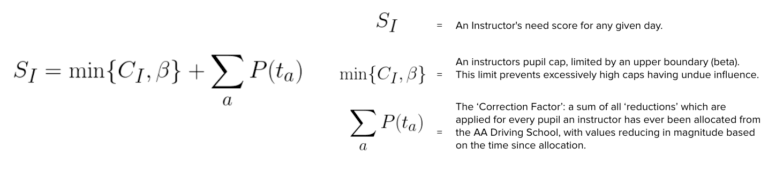
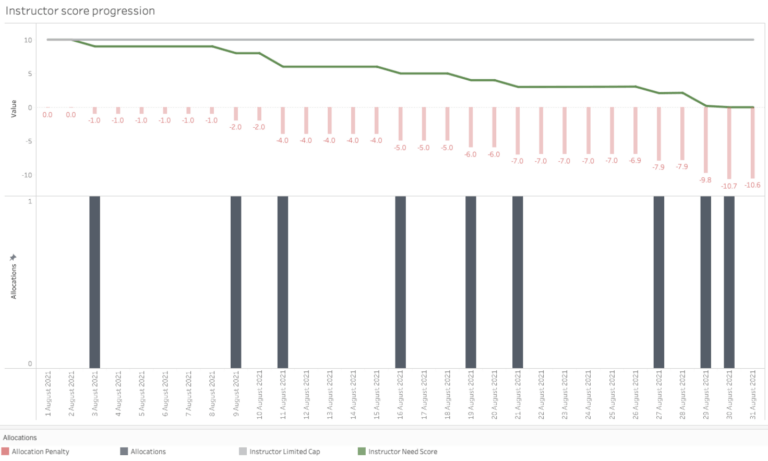
We eventually arrived at the above formula to calculate the instructor’s need score. It uses a modified instructor’s pupil cap (limited to what the business considered to be a reasonable number of pupils to have an instructor “fulfilled”) plus a correction factor (in effect a penalty added that factors in the sum of reductions applied for every pupil, with reducing magnitude based on time since allocation) calculated over the instructor’s current workload.
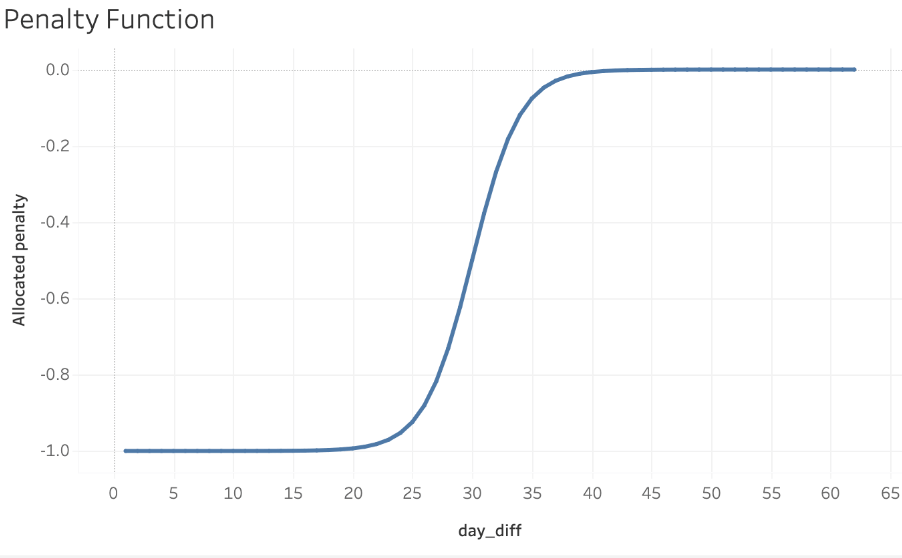
The correction factor was calculated with a sigmoid function (between -1 and 0) giving a -1 penalty for every pupil the instructor has acquired over the last ~30 days.
Putting it all together, this gives us a very intuitive and explainable score e.g. a given instructor’s need will be 2 if they require 2 new students in order to be fulfilled (up to their limited cap).
Regional need changing
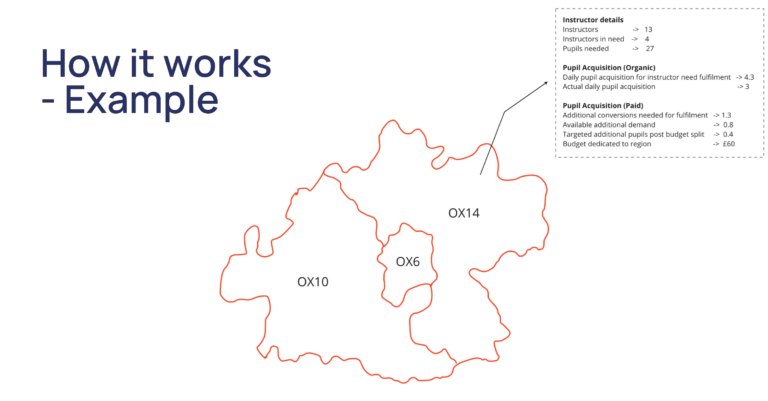
We then calculated a regional score: the sum of total instructor need in each area of operation.
The image above demonstrates constantly evolving levels of need across the country, with some areas coming entirely in and out of need, and others permanently in chronic need.
Stabilising the supply and demand ratio as far as possible across each area was a crucial goal for the project.
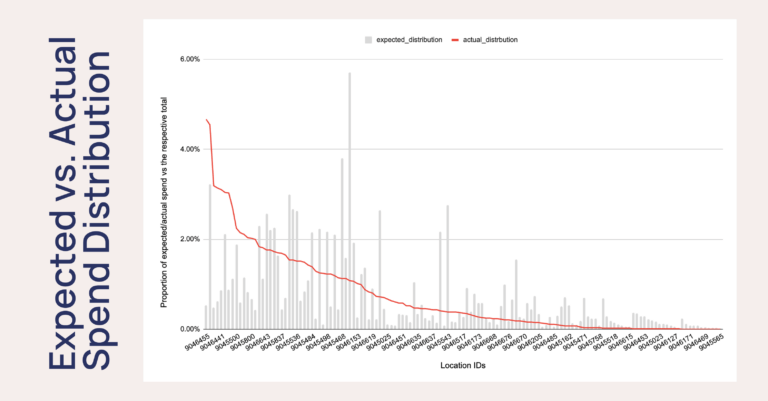
Distributing budget across regions
The AA has a limited budget dedicated to acquiring pupils, and this project aimed to get the most out of that budget.
Once we had identified how many instructors were in need in each area, we could first distribute budget to each instructor at an individual level, and then aggregate that upwards to postcode district level (budgets mentioned below are purely illustrative).
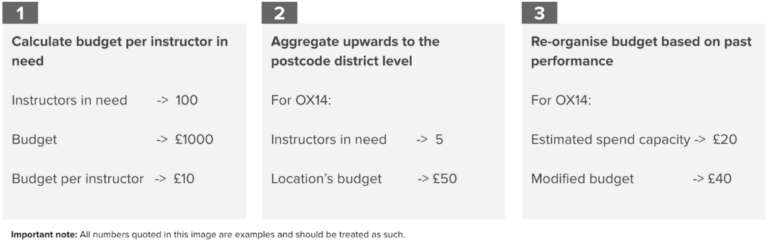
For each region we reviewed historical performance to confirm if we believed budgets set were reasonable and could be fully utilised. If not, we redistributed surplus to other regions.
Sounds simple, but there were some considerations:
-
- One instructor can operate across multiple postcode districts. We accounted for this by dividing their allocated budget across all the regions they sit across.
-
- We want to increase the likelihood that a student coming from paid acquisition goes to an instructor in need, but we have no control over what instructor the student chooses to work with. So Themis ensures that the region has a minimum number of instructors in need before switching that region on – which improves our reduction of instructors in need through this channel.
-
- We decided to implement changes and updates weekly in order to avoid frequent disruption to Google’s bidding algorithms. Given that, we needed to ensure a minimum threshold of need for each instructor.
Calculating regional CPC limits
The final aspect of the project was around setting efficiency controls. All campaigns were to use maximise conversion bid strategies, with us specifying maximum CPC limits – calculated using the following formula:

The expected conversion rate (calculated using historical data for each location) was used with the maximum value we specified as being willing to pay for a conversion to yield the maximum CPC required.
In instances where sufficient historical data was lacking to reliably calculate that expected CVR we opted for a hierarchical approach to estimating:
- Calculate historical CVRs at different geographical hierarchies (postcode district, postcode area, country)
- Select a minimum threshold of clicks for which we “trust” the conversion rate.
- Assign weightings for each hierarchy, from low to high level. These calculated weightings reflect the proportion of clicks contributed by each level of the hierarchy up until the minimum threshold is reached.
Worked example (figures used for example purposes only – these do not reflect real volumes in the account):
The postcode district OX14 has 40 clicks. As a minimum of 100 clicks is needed, this makes OX14 40% of that requirement.
The remaining 60 therefore come from the next hierarchy.
Excluding the OX14 postcode district from the larger postcode area OX, OX then has 300 clicks. This includes the entirety of the required additional number of clicks to make up 100, so it is assigned the full remaining 60% weighting.
4. Use those weights to calculate a blended CVR and apply that CVR as an estimate of future performance. I.e. continuing the example above, if OX14 has a 10% CVR and OX (excluding OX14) has a 3% CVR, the total calculated/weighted CVR would be 5.6% for the region.
A data engineering challenge: building the system
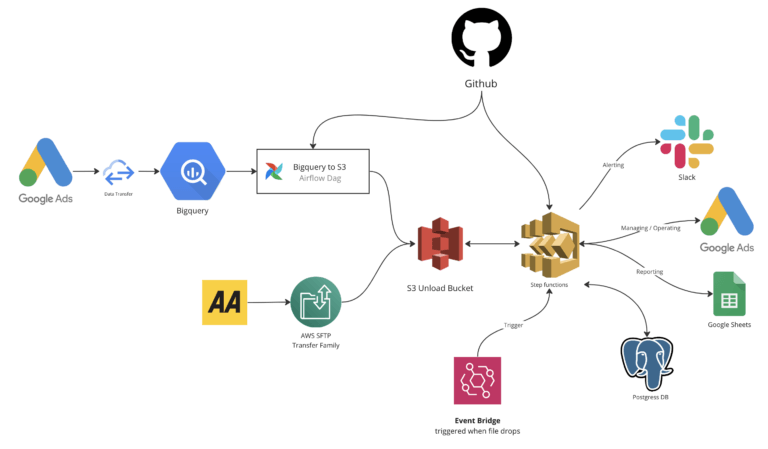
With the calculations for the model set, we then looked to bring in automation, with an AWS serverless based architecture, involving multiple different services in order to ingest, process and make calculations with the data, implement the model and then monitor and alert on both settings and real-time performance, with limited need for manual intervention.
Once built, the completed system had a few key levers that could be adjusted to modify the system’s behaviour in order to align with business objectives:
-
- Total budget
- Upper viable CPA thresholds per region – used to calculate max CPC limits – tweaked to influence aggression of the model.
- Minimum instructors in need per region and minimum pupils needed to service instructors in need: affects sensitivity of the system to transient regional need.
Results
The journey of developing and implementing Project Themis has been nothing short of remarkable for The AA and WeDiscover teams. Over the course of two years, with over 700 hours invested in the project and facing numerous challenges and iterations, a groundbreaking solution has been built.
Through leveraging automation, data analysis, and innovative strategies, the project has not only addressed the persistent issue of instructor retention due to a lack of students, but has also revolutionised The AA Driving School’s approach to student acquisition, achieving a harmonious balance between supply and demand on a scale previously unimaginable.
Themis has now been operating for some time (with minimal tech maintenance required). Over the first 6 months actual CPA has been 71% lower than previously forecast based on historical performance – a huge win for the channel.
As we reflect on this journey, it’s evident that the success of Project Themis extends far beyond its numerical achievements, symbolising the power of perseverance, creativity, and teamwork. With it, The AA has not only unlocked vast new opportunities for paid search, but also showcased the potential for continuous evolution and growth in the ever-changing landscape of digital marketing.