Building a Credit Map of the UK
Building a Credit Map of the UK
To improve CPA by 25%

Share
Introduction
Our client, who wishes to remain anonymous, is disrupting their industry by being able to provide popular goods at a significantly lower monthly cost.
They do this by leasing their products. In order to do this successfully, they perform a soft credit check on all applications to ensure monthly payments are affordable and to protect them against fraud.
If users are accepted, a full search will then be conducted.
The Challenge
Conversions within Google Ads were tracked at 2 levels:
- Application (soft credit check) – High volume and therefore was being used as the main conversion event.
- Sale (received product) – Lower volume (and inconsistent). Primarily used for reporting purposes rather than optimisation, due to these problems
Because a soft credit check is conducted, not all users who apply will become customers, in fact, a large proportion of applications are not suitable.
The challenge that our client found was that although there was a high volume of application conversions being passed back into the account, the majority of users within these conversions were not passing the soft credit check. And therefore by optimising towards this event the Google Ads bidding strategies did not provide consistent performance (due to the unpredictable outcome of the credit check).
The volume of sales conversion events (i.e. users who received the product) was much lower, and the reduced volume and stability of the conversion meant that our client was not able to find an efficient way to drive performance which would allow it to scale.
The client and WeDiscover then started to work together to solve this challenge.
We wanted to find a way to layer in targeting to find the right users who would benefit from our client’s unique product & at the same time, make paid search more efficient for our client.
The primary objective was to reduce the overall CPA and ensure that paid search could scale as our client grew.
Further iterations and bidding reviews would then be tested once significant volumes could be consistently achieved.
The Solution
Since efficiency-based bidding strategies were not working for our client as expected in this case, we decided to go back to first principles.
How could we increase the likelihood that a customer interacting with our ad had a higher than average chance of passing the initial soft credit check?
Our belief was that if we could increase the number of users who passed the initial soft credit check we would be able to drastically improve the sales CPA, which would then unlock more budget and the ability to scale the account.
We had two key initiatives for finding these users:
- By building a credit map of the UK, we could find users who were more likely to pass the soft credit check based on their location and adjust our activity accordingly.
- Leveraging Google audiences to adjust our activity based on a user’s similarity to those that have successfully ordered a product from our client.
So, let’s break those solutions down:
#1 Building our credit map of the UK
Our first step was understanding the correlation between available UK deprivation and income metrics against our client’s internal conversion rates.
We turned to the Office for National Statistics (ONS) and downloaded publicly available data on average income and deprivation levels by postcode districts for the UK.
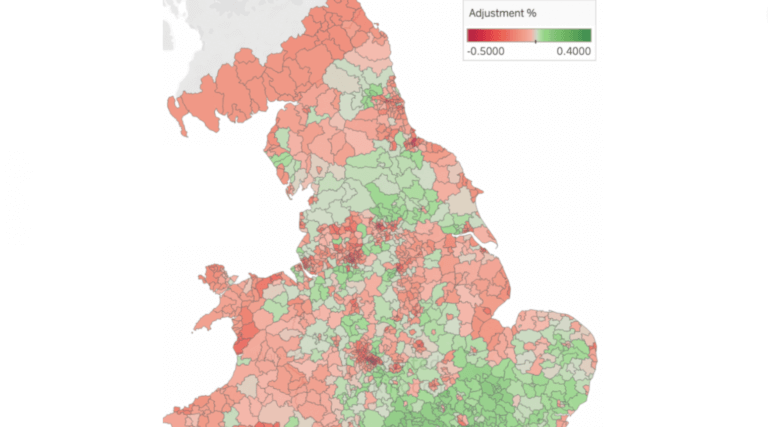
We then built a database with predicted acceptance-based bidding adjustments per district based on the likelihood of users within that district having a higher or lower prosperity calculation & higher or lower average income level after housing costs against the national average.
The bidding adjustments (i.e. the relative adjustment) would then be used within the Google Ads platform as bid modifiers.
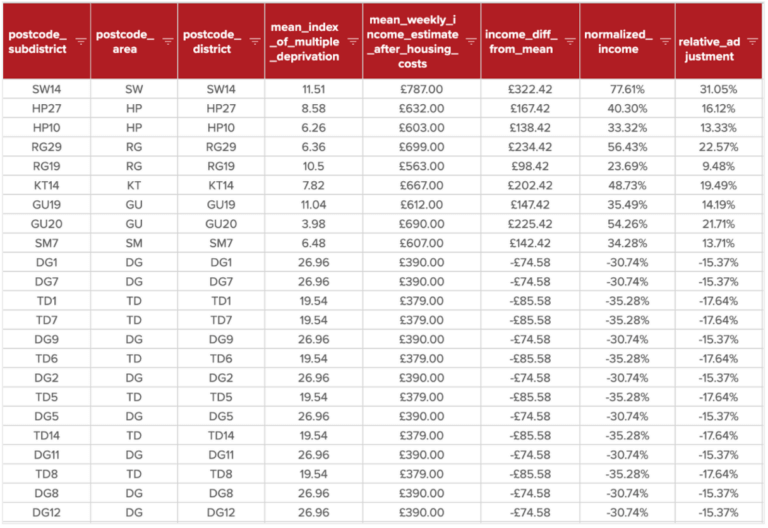
Sample of the bid calculations
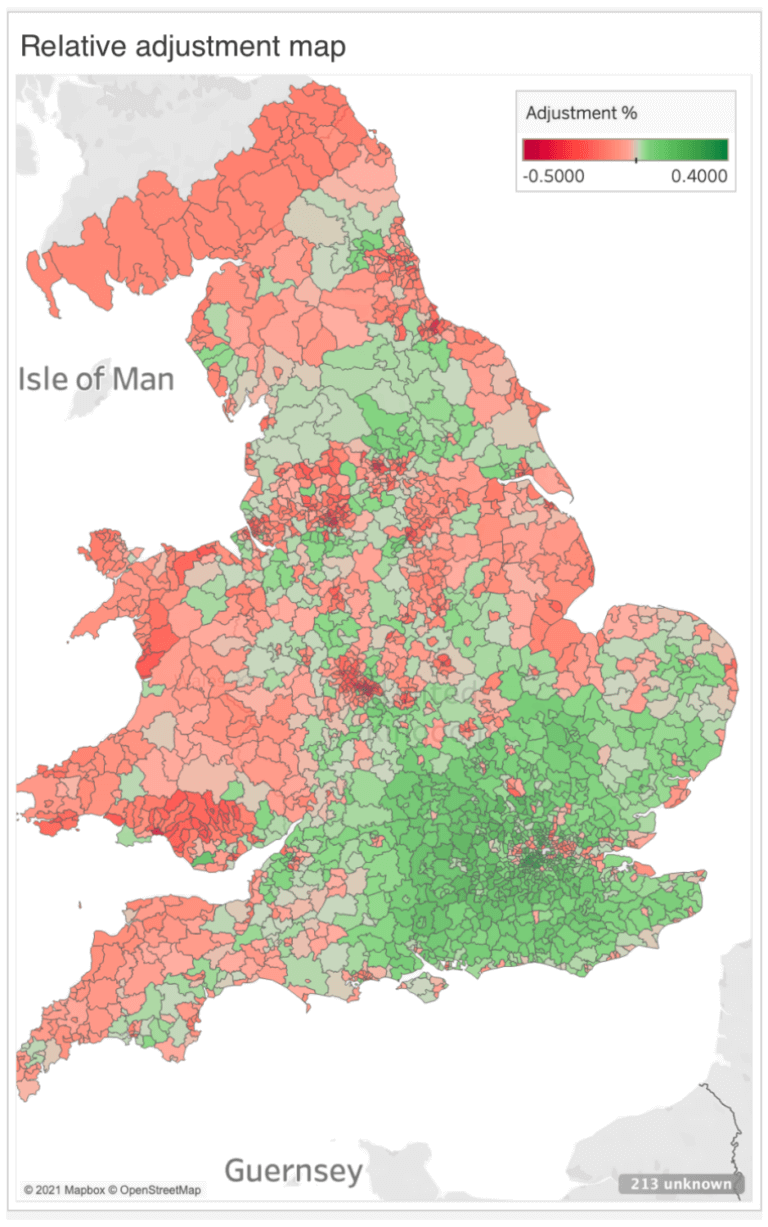
Sample of the bid adjustment map
Once the database was built and our predictions created, we wanted to validate the correlation with actual acceptance or rejection rates from our client.
Checking actual acceptance or rejection rates vs. internal data would validate our credit map calculations, and therefore allow us to move forward with an in-platform test.
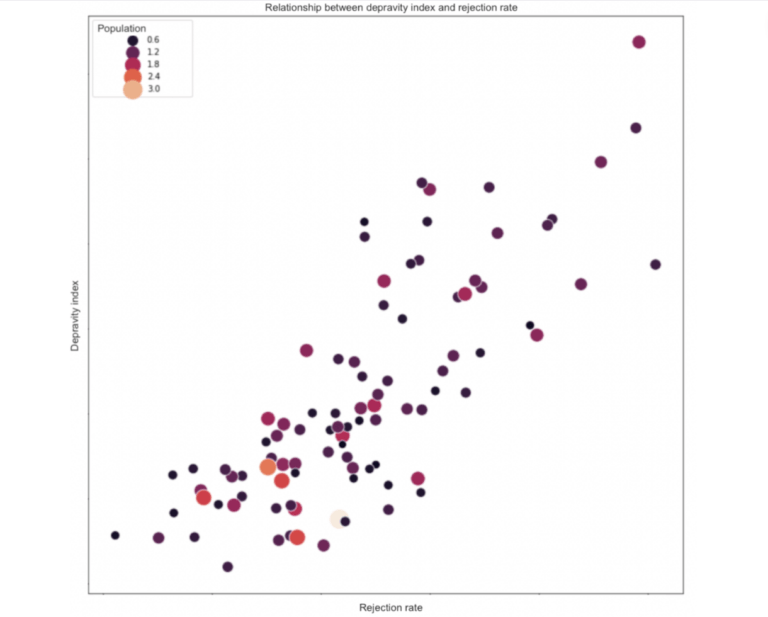
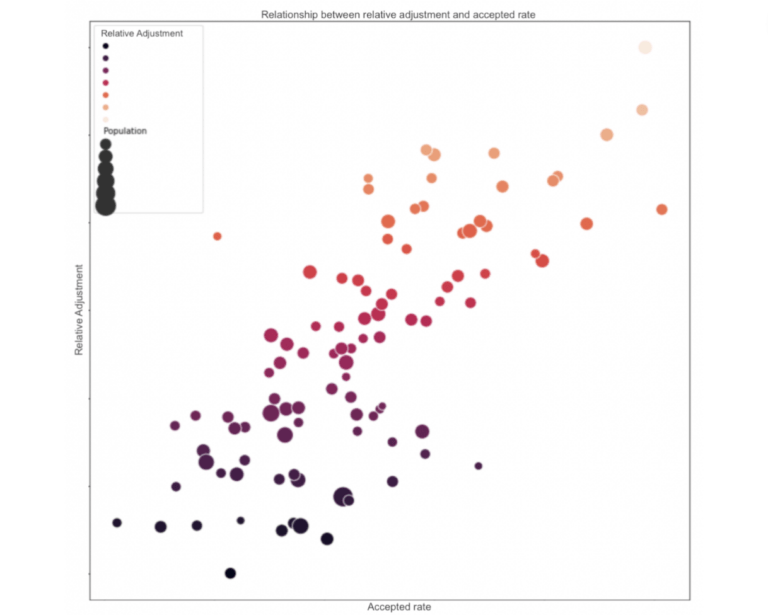
We did indeed find a strong correlation between our combined deprivation index and the rejection rates observed by our client.
The next step was to move forward with a test in Google Ads with geo-location bid adjustments.
#2 Leveraging Google audiences
With our credit map built (i.e where users are who are more likely to be accepted), we wanted to find users with behavioural traits who were more likely to be accepted.
When approaching audience management we wanted to look at this from 2 sides:
-
- Users who are like customers who have been accepted (i.e. we want to find more of these users).
- Users who are like prospects who have not passed their soft credit check (i.e. we want to avoid showing ads to these users).
We already had conversion events set up for sales, so we created an additional conversion event for ‘rejections’. These conversion events were not used for bidding, but purely for reporting and sending user data back to Google Ads.
Once significant data was passed back, we started to review the data insights for each audience (and their various lookback periods), and we picked out relevant in-market audiences where a high index was achieved.
Once we had the highly indexed in-market audiences for both targeting (i.e. users who were like our converters) and exclusions (i.e. users who were like our ‘rejections’) we were ready to test them in the platform.
The Results
The standard operating procedure for account management is to use smart bidding in most cases no matter what. But what happens when there are circumstances where performance is inconsistent and accounts struggle to scale?
What we did with our client was to go back to first principles and build a custom technology-enabled solution that allowed them to find the right type of customer that was more likely to convert.
8 weeks
Testing period to reach statistical significance on the results
24.87%
Improved sale conversion efficiency due to more users being accepted
99%
Statistical significance confidence level
This improvement in sale conversion efficiency will allow our client to invest more capital and increase sale conversion data within the account.
From here, the next steps will be to build a new offline conversion process so that we can eventually use the sale conversion event as the main signal for Google Ads bidding strategies. And test those against the existing strategy (as we always do).
If you have any questions about this case study please reach out via our contact us page.