
Branded Share of Search Reporting
Branded Share of Search Reporting

Share
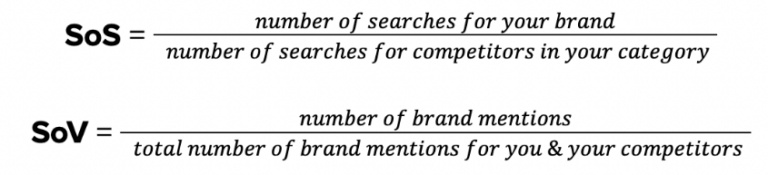
If you are familiar with marketing data, it is quite likely you will have heard of the term Share of Voice (SoV).
Although similar, this project focuses on something – termed by Les Binet – known as Share of Search (SoS). Mathematically speaking the distinction between these two terms can be summarised as per the following:
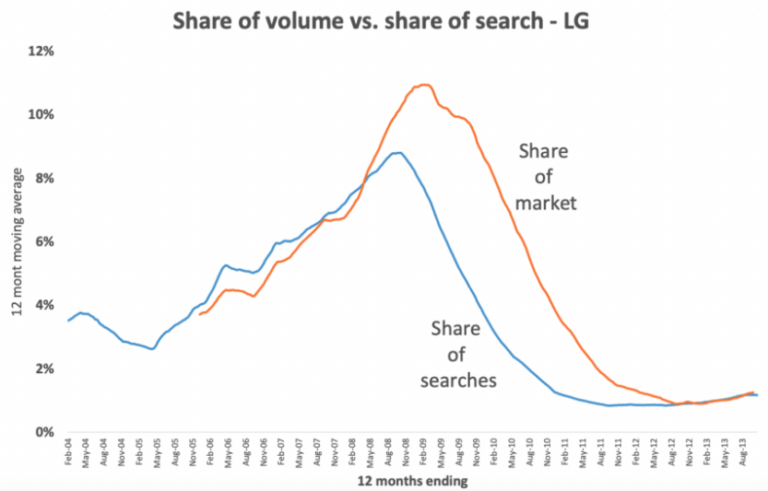
Research conducted by Les Binet & Co has shown that SoS is a good indicator of how market share will be distributed across competitors. The below is an example of the mobile phone industry, focusing on the brand LG:
Methodology
Theoretically, there are multiple approaches and sources of data we could have used in building a Share of Search report, including Google Analytics, Search Console & more.
However, we settled on a solution that leverages the following two tools:
- Google Trends – Shows index of popularity of search queries on Google Search across various regions and languages.
- Historic Keyword Planner Data (via Google Ads) – Enables you to see monthly search volumes for a certain keyword/search term over time.
Read on for our take on how we approached SoS reporting, or check out our video instead.
Google Trends
Understanding the Source
In Google Trends there are 2 distinct ways of searching for a brand – using Terms or Topics. Fundamentally, these can be summarised as follows:
- Terms – Get matches for the terms in your chosen language. Depending on set up, this can be broken down into sub-categories as follows:
- Simple search for the term – e.g. if you search John Lewis you can get matches for “John Lewis furniture”, “shop John Lewis” or even “Lewis John”.
- Phrase search – By wrapping the search term in quotes “John Lewis” you limit the searches to phrases containing those two words in that order e.g. “John Lewis”, “shop John Lewis” etc – this works in a similar fashion to Exact match keywords.
- Topics – a group of terms that share the same concept in any language.
- For example, if you search London, and choose the corresponding topic, your search includes results for topics like “Capital of the UK” and “Londres,” which is “London” in Spanish.
In the context of SoS both of these can be used, though Phrase Searches are most appropriate in the majority of instances (exceptions are brands with broad names that can also mean something else e.g. Coral, Next, Thread).
Source Limitations
Although a powerful source, Google Trends has some limitations in relation to data usability & quality: because the data is indexed and sampled, understanding the total volume becomes almost impossible.
Actual search volume is of paramount importance for this project. Using Google’s Keyword Planner is an opportunity to un-index this data.
There are some considerations we need to note:
- As Google Trends data is sampled, what is the sampling error in this data?
- Is Historic Keyword Planner data an accurate representation of actual search volume? Does un-indexing the Google Trends in this nature provide an accurate representation?
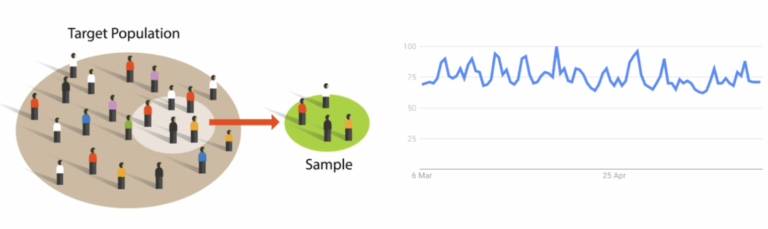
The LHS above shows an example of sampling a population, while the RHS shows an example of indexed data retrieved from Google Trends.
Data Validation: Google Trends Sampling Error
To understand the sampling error in Google Trends data, we set up an automated extraction from the Google Trends front end for 2 brands of differing sizes in terms of total search volume.
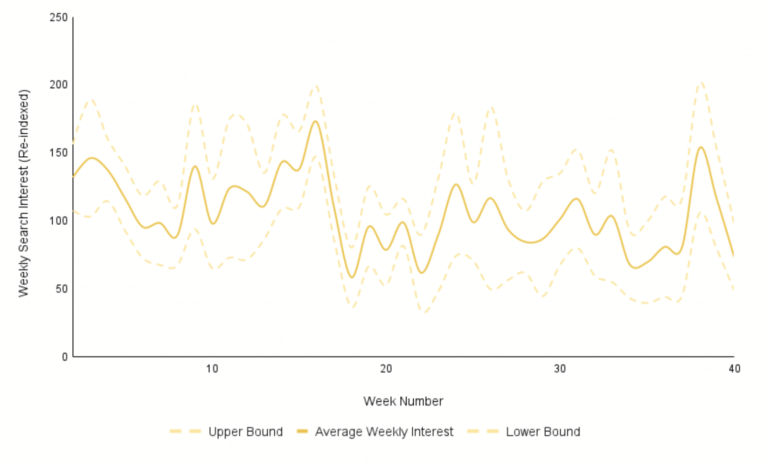
Using this data we then compared the lower & upper boundaries of the data relative to the average, to determine the overall sampling error. From this, it can be concluded that for brands with sufficient search volume – > 20,000 searches per month – the sampling error is minimal, however, for smaller brands the error incrementally increases. As such, this approach is not applicable for all brands.
This example shows interest for a low volume brand with ~5,000 monthly searches, and its associated error.
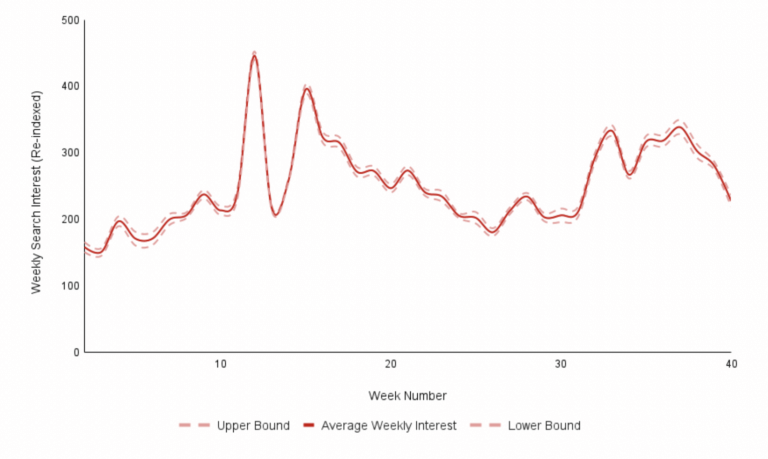
While the example below shows a higher volume brand with ~300,000 monthly searches, and its smaller error bounds.
Keyword Planner
Before we can start to investigate whether or not we can use Keyword Planner to un-index Google Trend data, we first need to understand the data available.
As mentioned, keyword planner enables you to see monthly search volumes for a certain keyword/search term over time (up to last 4 years). The issue with this data is that it is bucketed i.e. Google does not provide the exact search volume for the term but instead a rounded figure for the searches that month. The size of these buckets is dependent on the size of the search query but generally the bucket increments are around 18% of the next increment’s value.
Fundamentally, this issue adds in-built error into the system that cannot be avoided. However, this data source enables us to at least get some kind of nominal understanding of the market volume for a brand/market.
To validate the accuracy of un-indexing Google Trends data against Keyword Planner volumes, our best point of reference is Search Console data for branded terms.
When we compared Keyword Planner volumes vs Search Console for two of our clients in a given month we observed the following:
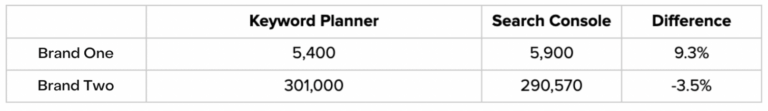
Coupling this with Google Trends data we then gained a weekly/monthly view of search interest (we avoided daily due to short-term volatility) for the different brands. Combining multiple brands within a market we then got a view of relative search volume (and market competitiveness).
Case Studies
We explore the SoS logic with two industry examples here.

Comparing Share of Market
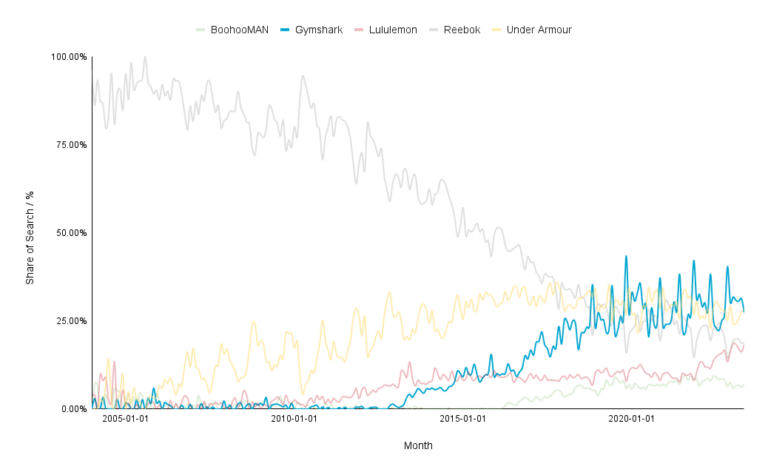
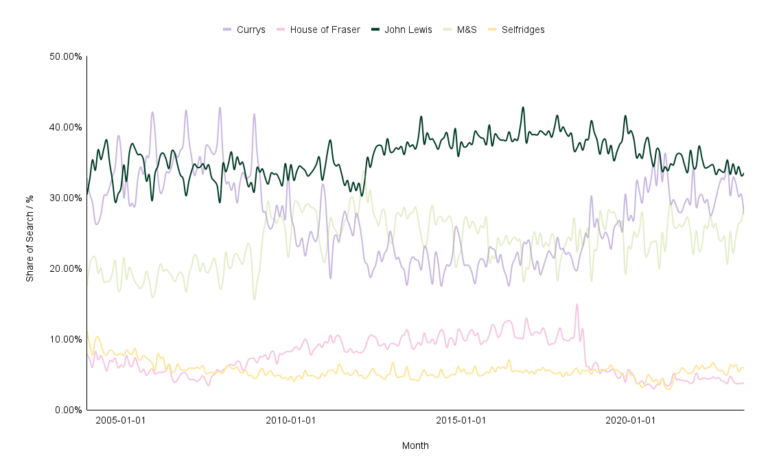
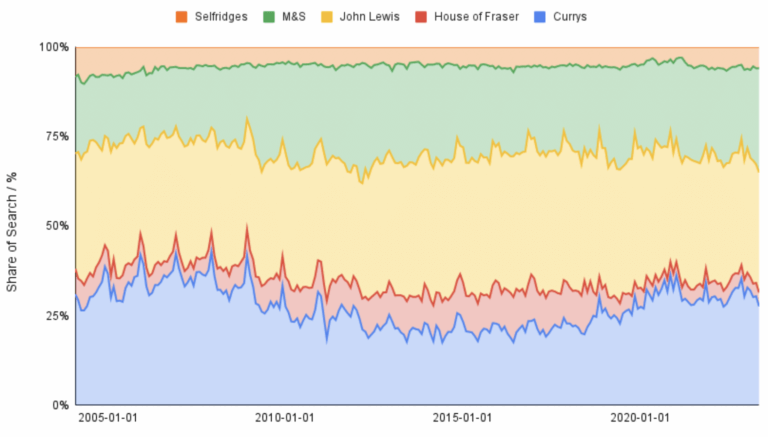
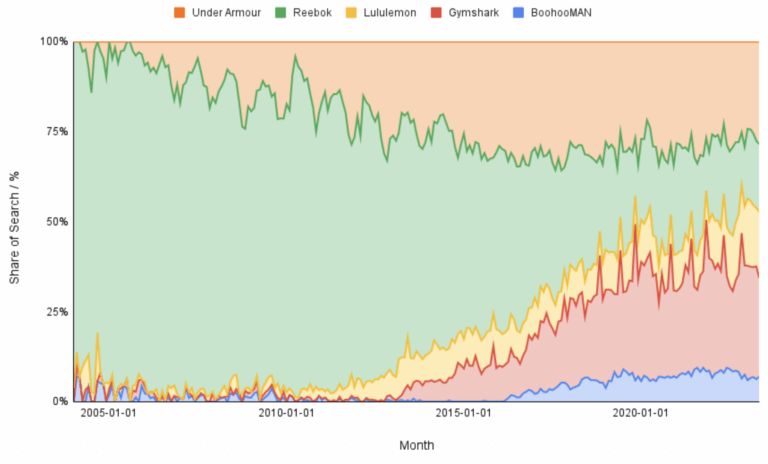
Comparing the share of the market across the two brands we see from the first example that the overall retail market has seen large stability (with the exception of House of Fraser seeing a substantial drop off), whereas, in the Gym/Fitness market shown in example 2, older brands like Reebok have seen their SoS reduced whilst brands like Gymshark have seen stark increases.
John Lewis share of market over time:
Gymshark share of market over time:
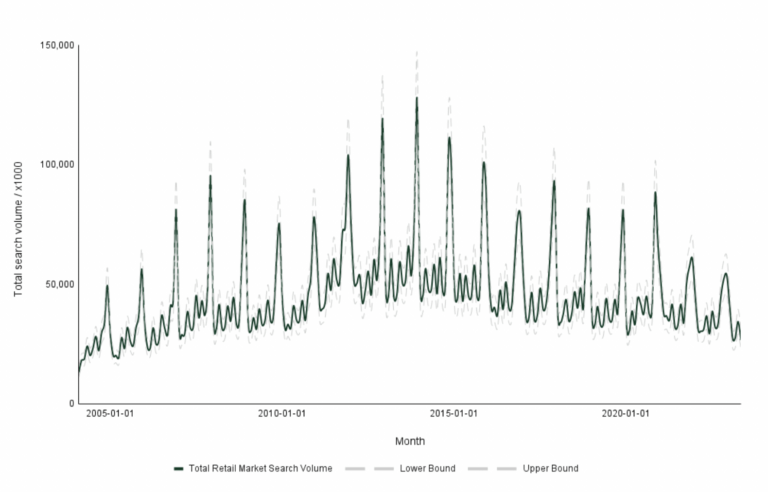
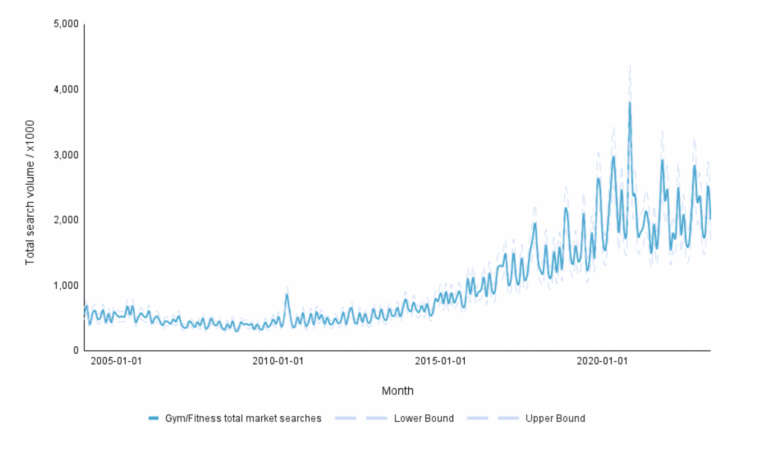
Comparing Total Market Size
Comparing total market size we see stark differences in a more stable retail market versus a growing fitness market.
John Lewis & competitor’s total search volume over time:
Gymshark & competitor’s total search volume over time:
Summary
In marketing, one of the greatest challenges for brands looking to grow is understanding the competition within a market & where your company sits.
Share of Search acts as a point of reference for overall search performance and a leading indicator for more difficult to monitor measures like Share of Voice. As such, by monitoring and understanding this measure, businesses can determine the required aggressiveness of their search marketing to drive sustained business growth.
We’d love to hear your thoughts and experiences with share of search reporting – get in touch with us here.