
Maximise Your ROI with this Advanced CPC Distribution Tool
Maximise Your ROI with this Advanced CPC Distribution Tool
Use our CPC Distribution Tool for in-depth CPC analysis and gain the insights you need to stay ahead of the competition

Share
Important Links
You’ll find out CPC Distribution Tool script on our GitHub here: WeDiscover GitHub
Not sure how to install it? Don’t worry, we’ll show you how to do that later on in this post.
Are your CPCs going through the roof?
Do you feel like your CPCs have been rising over time? What if there was an easy way to identify some of the most expensive clicks? Fortunately, we’ve created a simple tool to help you do just that.
Sure, you could just look in the UI and sort your keywords and search terms to find their average CPCs but we’ve found it particularly useful to visualise those CPCs on a chart. That allows you to put into perspective how much you’re spending on those more expensive clicks and work out whether it’s worth cutting them off or not.
With some bid strategies, it’s possible to set a Max CPC bid cap, for example, with a portfolio bidding strategy. Having that option available, it can be useful to have a guide to find out exactly how much you’re spending to drive traffic to your website.
Of course, we’re never going to have as much data as Google does and the average CPCs that we see in our account are exactly that – averages. We almost never know how much a specific click costs, unless we happen to only have one click’s worth of data to look at.
Despite these limitations, what we can do is plot those average CPCs so that we can have a general idea of how much our clicks are costing, whether they’re cheap or expensive and whether it’s worth cutting some of the clicks at the top end in order to bring our costs down.
Needless to say, putting a bid cap in place will inevitably cut off some of your traffic. Whether it’s worth cutting it off is what this tool can help you decide. Not only does it help you visualise where a particular CPC lies in the whole range of CPCs within a particular campaign but it also shows the estimated percentage of clicks you might lose from that campaign if you were to set a Max CPC bid cap at a specific level.
On top of that, it’ll also tell you how many conversions or how much conversion value you might lose if you cut off traffic using a Max CPC bid cap too, making it a useful tool to work out whether a Max CPC bid would be useful to implement within your account, as well as how much traffic, conversions and conversion value you could be cutting off by setting one.
Video walkthrough
You can continue reading on below to find out how to set up the sheet and use it, or check it out in the video above if you prefer.
Setup Instructions
In terms of setting it up, it’s fairly simple to do. If you haven’t installed a Google Ads script before, here’s a quick guide to show you how to do it. However, if you’re a seasoned script veteran, feel free to skip over the below and jump to “Reading Your CPC Distribution Report.
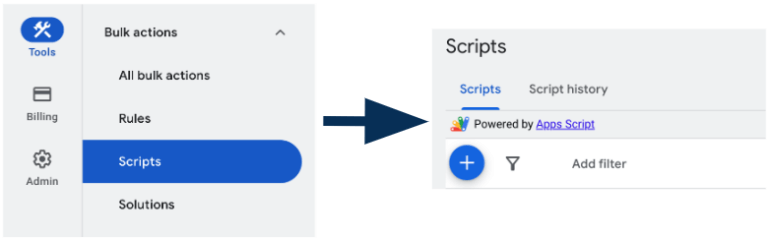
Sign in to your Google Ads account and click on the Tools icon in the menu on the left of the screen. In the drop-down menu that then opens up, click Bulk Actions and then Scripts.
Then, click on the blue “+” icon to create a new script.
Delete anything that is already in the code editor. Once you’ve done that, copy and paste the full script from GitHub into the box on Google Ads.
Give the script a memorable name at the top. This will allow you to easily differentiate between the different scripts running on your account.
Click Save in the bottom right of the script editor to save the script.
How to run the script
Technically, you’re all done. If you want to run the script as is, you can. In the bottom right of the script editor, you’ll see the “Run” button, which you can click after authorising the script. (Due to an odd Google Ads quirk, you may have to authorise the script twice before it will run so don’t worry if it doesn’t authorise the first time.)
However, if you’re running the script for the first time, there are four settings that you might want to tweak beforehand.
Lookback Period
In the lookback period section, you need to enter the time period you want the script to use to analyse your CPCs. We’ve kept it simple and put the seven available options for you in a comment in the script for easy reference.
Those options are “TODAY”, “YESTERDAY”, “LAST_7_DAYS”, “THIS_MONTH”, “LAST_MONTH”, “LAST_14_DAYS” or “LAST_30_DAYS”. All of these are fairly self explanatory (and you’ll likely be familiar with them if you use Google Ads on a regular basis) but for completeness, here are what each of those periods means below:
- TODAY: Data from today only
- YESTERDAY: Data from yesterday only
- LAST_7_DAYS: Data from the last seven days not including today
- THIS_MONTH: Data from all of the days in the current month
- LAST_MONTH: Data from all of the days in the previous month
- LAST_14_DAYS: Data from the last 14 days not including today
- LAST_30_DAYS: The last 30 days not including today
These have to be input exactly as shown above, so you may want to copy and paste the above to be safe.
Alternatively, if you misspell something or leave this option blank, the script will use its default setting of LAST_30_DAYS. Depending on the size of your account, this may be the best choice for you too. If it is, feel free to leave this option blank and move onto the next one.
Campaign Name Contains
If you hadn’t guessed already, this option allows you to filter to only specific campaigns. If you only want to look at your Brand campaigns (assuming they all have “Brand” in the name), you just enter “Brand” here within the square brackets.
You can also do this for multiple campaigns, if you’d like. For example, you can enter [“Brand”, “PMax”] with the two names separated by a comma in order to only look at campaigns with “Brand” OR “PMax” in their name.
In practice, you might not need this filter since you can use the drop-down menu in the report itself to select the campaign which interests you the most but it can be a useful addition in some cases so we added the feature just in case.
If you don’t think you’re going to need this, just leave it blank.
Campaign Name Does Not Contain
If you’ve read the description for Campaign Name Contains above, this is simply the opposite. Any campaigns that you don’t want to include? Just enter something which appears in their name here.
Like above, you can also enter multiple campaigns to exclude here too by putting them in speech marks and separating them with commas like so: [“Generic”, “Legacy”]. This example will mean campaigns with “Generic” OR “Legacy” in their name will not be included in the report’s data.
Regardless of how many campaigns you want to exclude, you’ll need to enter each one in speech marks within the square brackets.
Again, since you have the drop-down menu in the report to select the campaign that you want to analyse, feel free to leave this blank.
Email Addresses
Arguably the most important out of all of these options is the one for email addresses. Entering your email address in here means that the script will send you an email with a link to your spreadsheet automatically. This is particularly useful if you schedule the script to run on a regular basis (for example, once every month) and would rather have the report sent straight to your inbox. All you have to do is enter your email address into the speech marks and the script will email you your CPC Distribution Report for the lookback period specified above every time it runs.
You can actually email multiple people this report at the same time, if you like: Just enter the email addresses separated by commas, e.g. “adam@example.com,byron@example.com”.
Although everyone listed will get the email to the report, you’ll need to grant these users access to the report once it’s created. It’s a minor annoyance (and it’s something that we might change in future versions of this tool) but for now, it’s a simple way to keep your data from ending up in the wrong hands. After all, what if you misspelt an email address?
Now that you’re all done with the four options, you’re free to let this thing run. Just click the Run button in the bottom right of the script editor, authorise the script (if you haven’t already) and you’re good to go.
Reading Your CPC Distribution Report
Congratulations! You’ve run the script, clicked the link in your email and are now the proud owner of your very own WeDiscover CPC Distribution Report. Now what? Here’s a guide on how to read your report, where everything is and what to expect.
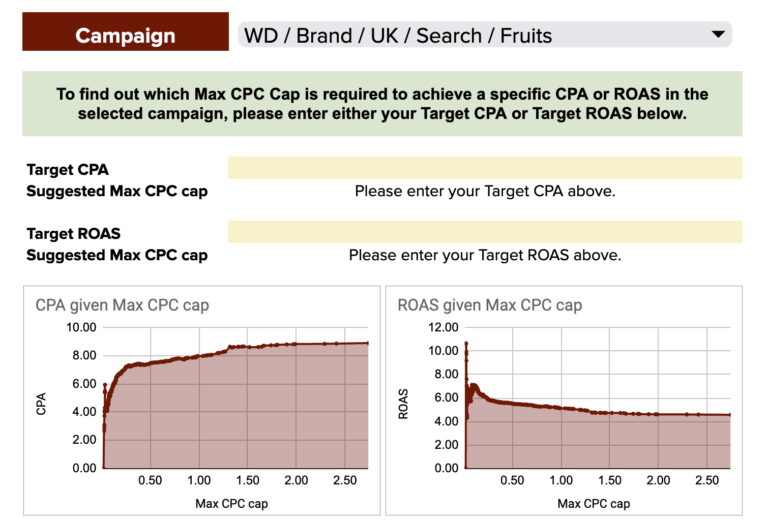
At the top left of the report, you’ll see a drop-down menu where you can choose the campaign that you want to analyse. Once you’ve selected your campaign, the rest of the report will update accordingly.
Below that are two input boxes where you can enter in your target CPA or target ROAS for this particular campaign. We’ll cover those and how they work in the Interpretation section next.
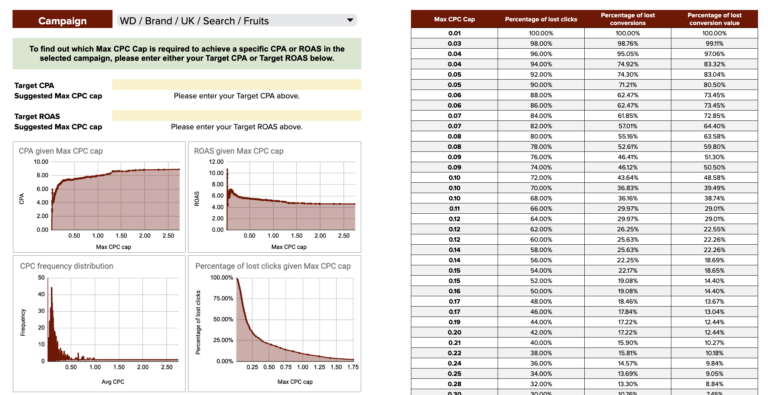
Also on the left hand side, you’ll see that there are six charts in the report:
- CPA given Max CPC cap
- ROAS given Max CPC cap
- CPC frequency distribution
- Percentage of lost clicks given Max CPC cap
- Percentage of lost conversions given Max CPC cap
- Percentage of lost conversion value given Max CPC cap
There’s also an accompanying table on the right showing the percentage of lost clicks, lost conversions and lost conversion value for a given Max CPC cap in tabular form too, in case you prefer looking at things that way.
Interpretation
This is a lot of information to take in at once. How do you even go about interpreting it all? Here’s how we do it.
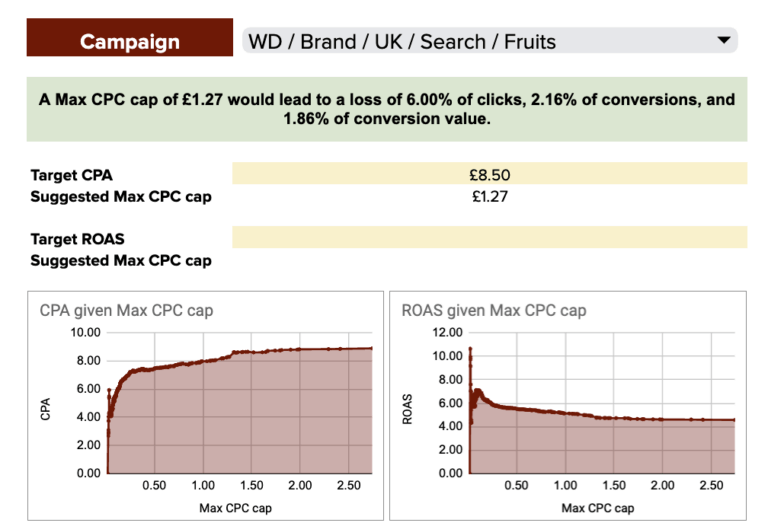
First of all, there are the two boxes where you can put in a CPA or ROAS target. By entering your target into one of these two boxes, you’ll be able to see the Max CPC cap suggested to enable you to hit this target in this campaign.
Above these two boxes, you’ll see a message telling you how much click volume, conversion volume and conversion value you might lose if you implemented such a cap.
The first two charts visually show you what you could expect your CPA or ROAS to be if you implemented a specific Max CPC cap. The report looks at all of the search terms currently in the campaign and calculates what the CPA or ROAS would have been if you didn’t show for any of the search terms which cost more than the proposed cap.
Following these is one of the most interesting charts – the CPC frequency distribution. This shows all of the Avg. CPCs for the search terms in this campaign plotted by frequency. This allows you to get an idea as to how much you tend to pay for traffic at different CPC levels.
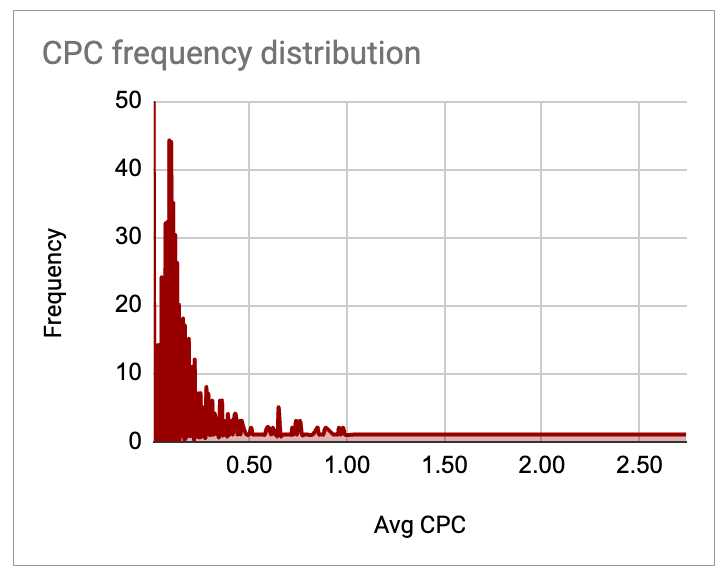
When it comes to the CPC frequency distribution chart, what’s of most interest is the shape of the curve. Questions you might like to ask are:
- Where do CPCs tend to peak?
- How spread out are the CPCs? Do they have a tight range or a small range?
- Are there any spikes at higher or lower CPC levels?
By answering the questions above, you can work out how much cutting off some of the CPCs at the top end could impact your performance.
The other charts show you the percentage of volume that you could potentially miss out on by setting a Max CPC cap at that level for the campaign. By seeing this information visually (and combining it with the conversion and conversion value-related graphs below), you can get a better idea as to whether it’s a good idea or not to implement a bid cap.
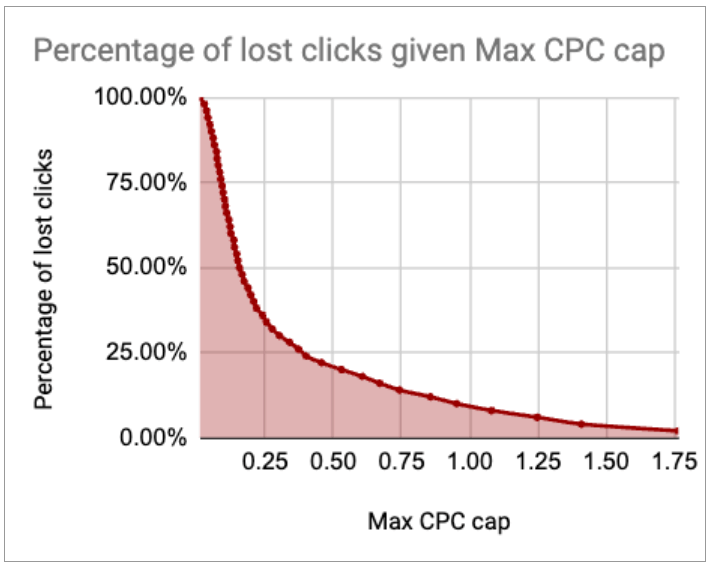
A normal looking chart would be one where the line smoothly curves from the top left corner to the bottom right corner.
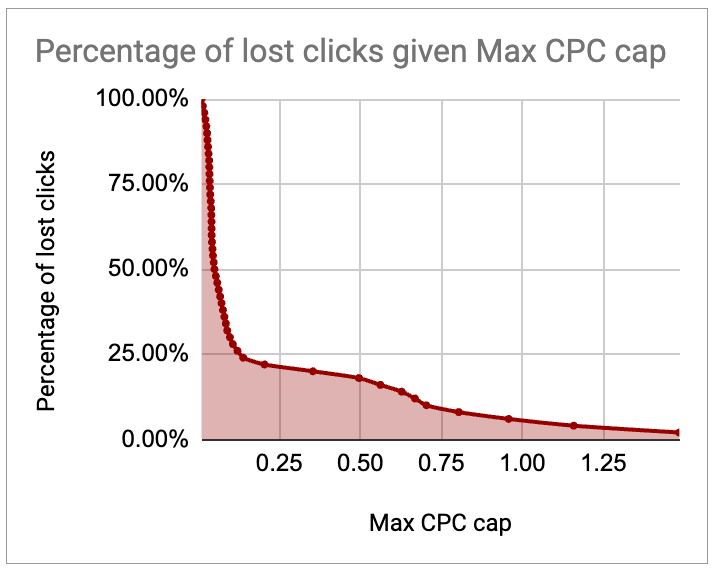
However, if your chart is more L-shaped (see below) and drops steeply on the left side that indicates that most of your clicks are low cost and a few are more expensive than the others. This means that setting a high Max CPC bid cap will have little impact on your volume since most of your clicks are probably cheaper than this.
The final two charts show the estimated percentage of conversions and conversion value lost given a Max CPC cap.
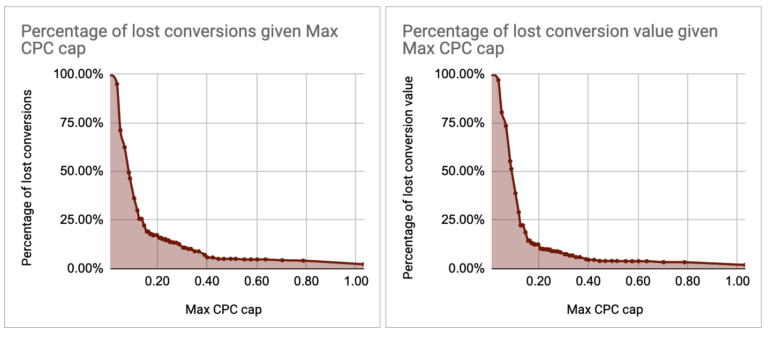
Usually, these two charts should look very similar in terms of their shape. If they don’t, this often means one of the following things is true:
- You have little to no conversion value data in your account
- You have outliers in your data with higher than usual average order values
The first is easy to rule out – if you have no conversion value data in your account, you’ll see the percentage of lost conversion value given Max CPC cap will show up as a straight line. Otherwise, if they differ, you may have had a few massive transactions or lots of tiny transactions which are skewing your data.
The explanations above should give you a rough idea as to how you could interpret your findings. Once you’ve done that, what should you do next?
Next Steps
Now that you have this information at your fingertips, there are a few actions that you could take. Two of the most common are:
- Adding a Max CPC cap to your campaigns
- Adjusting your bid strategy targets
Add a max CPC cap
Not everyone knows this but you can add a Max CPC bid to your campaigns to stop bidding algorithms from overbidding for traffic. If you’re using Maximise Clicks or Target Impression Share for example, you can add a Maximum bid limit via the campaign settings.
However, most advertisers are using automated bidding for their campaigns which don’t have a Maximum bid limit option as standard. What if you’re using Target CPA or Target ROAS, for example? In this case, you can create a portfolio bid strategy and apply it to only one campaign. This allows you to use Target CPA or Target ROAS and still set a Maximum bid limit.
Of course, if you’re in the 0.1% (made up stat) of advertisers still using Manual CPC or Enhanced CPC for your campaign, this is extremely straightforward to do – you just adjust your bids accordingly.
Adjust your targets
Based on the information provided, if you’re using automated bidding, you may also choose to adjust your targets for your campaigns. For example, if you’re seeing a tendency for lots of cheap clicks and fewer expensive clicks in a campaign using Target ROAS, you may want to increase your ROAS target to drop bids lower since this should drive better performance while having a negligible effect on volume. Similarly, for Target CPA, you could decrease your CPA target in order to bring down bids.
Closing thoughts
We believe that great reporting is essential for improving digital marketing performance. Reports can be a simple way to work out what’s working well but can also highlight potential areas of improvement, as well as give an indication as to how to change things moving forward.
We hope that you find our CPC Distribution Tool useful. Once you’ve run it on your account, get in touch with us and let us know how well it worked for you!