
Google Ads Experimentation Studio & Script
Google Ads Experimentation Studio & Script

Share
Introduction
Testing and experimentation should be at the heart of how all Paid Search management is done.
Doing this well means not just simply concluding a test when one variant has outperformed another with a single raw metric, but ensuring that tests exhibit statistically significant (with statistical power) findings before making any decisions to favour a particular variant.
Because we run these reports on a regular basis, we have built tools to automatically pull data and send us updates on tests. We’ve released an open-source Google Ads Script + Google Sheets report template to help you run more effective tests & alert you when they have concluded.
With our script and sheet you can: run a traditional A/B test with a control and a variant, run a Multivariate Test (MVT) with up to 6 different variants, run pre-post testing or, run a test using Drafts and Experiments (D&E) in Google ads.
Video walkthrough
The sheet
Our Google Sheets report summarises the key Google Ads metrics commonly examined in testing, alongside other metrics involved in A/B testing or MVT’s, such as Standard Error (SE), and upper and lower Confidence Intervals (CI).
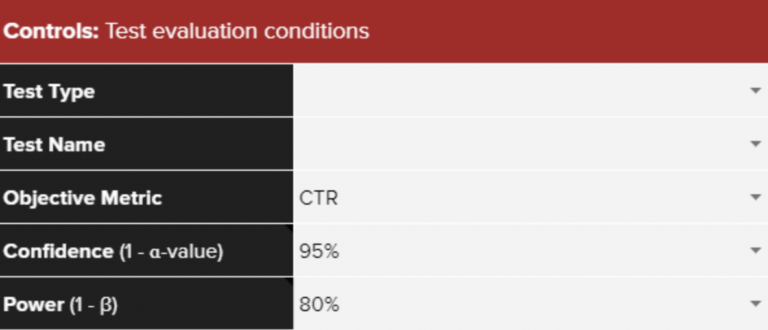
The Confidence Level (1 – p-value) of your tests can be adjusted in the controls section at the top of the results tabs of the report alongside a dropdown to select Power. More on this in the ‘Understanding Your Results’ section later in this article.
Three different commonly used objective metrics (CTR, CvR and CPI) can be looked at in the Drill Down tabs, to give you a truly well rounded idea of performance.
The upper and lower limits of your CI are then shown alongside your SE in the tables in your sheet.
If all of that doesn’t mean much to you, the Statistical Test Outcome columns show whether statistical significance has been achieved and, if so, whether each variant has performed statistically better or worse than all other variants.
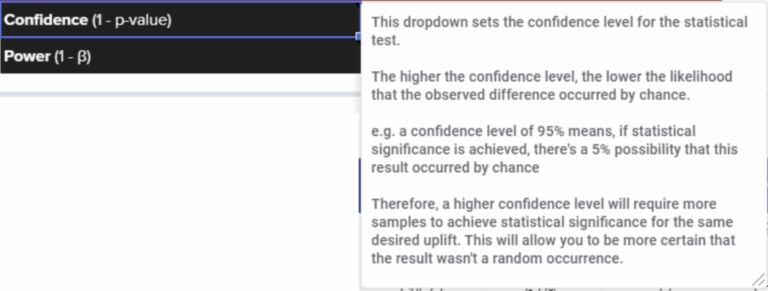
All statistical terminology comes with embedded notes when hovering over the respective cells (Confidence, Power, SE, Test Outcome and Variant Exposure).
There is also a specific Glossary tab in the sheet which provides a list of terms in each section alongside their definitions.
These notes – aimed at those less familiar with these types of calculations but also useful as a refresher for those who are – provide greater context to the results displayed.
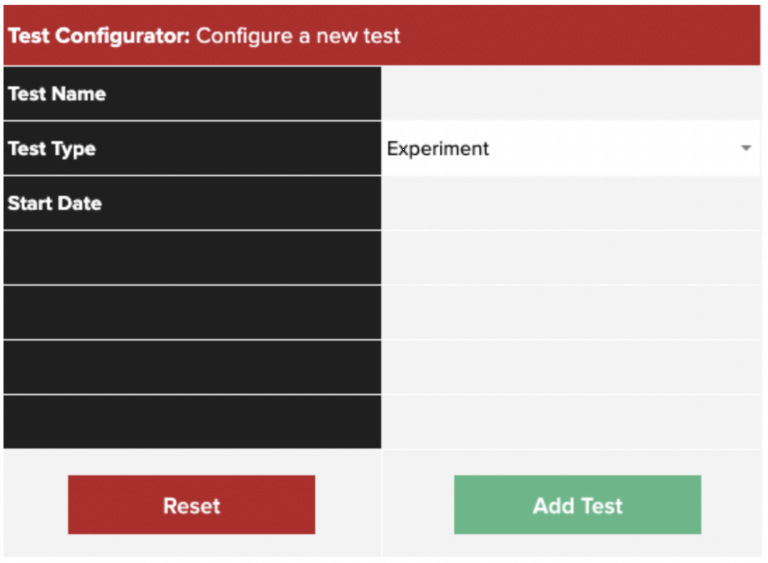
The sheet can hold data on multiple tests, with an option to filter between them in the fixed header at the top of each reporting tab (under Test Name in the Controls panel – see screenshot 1).
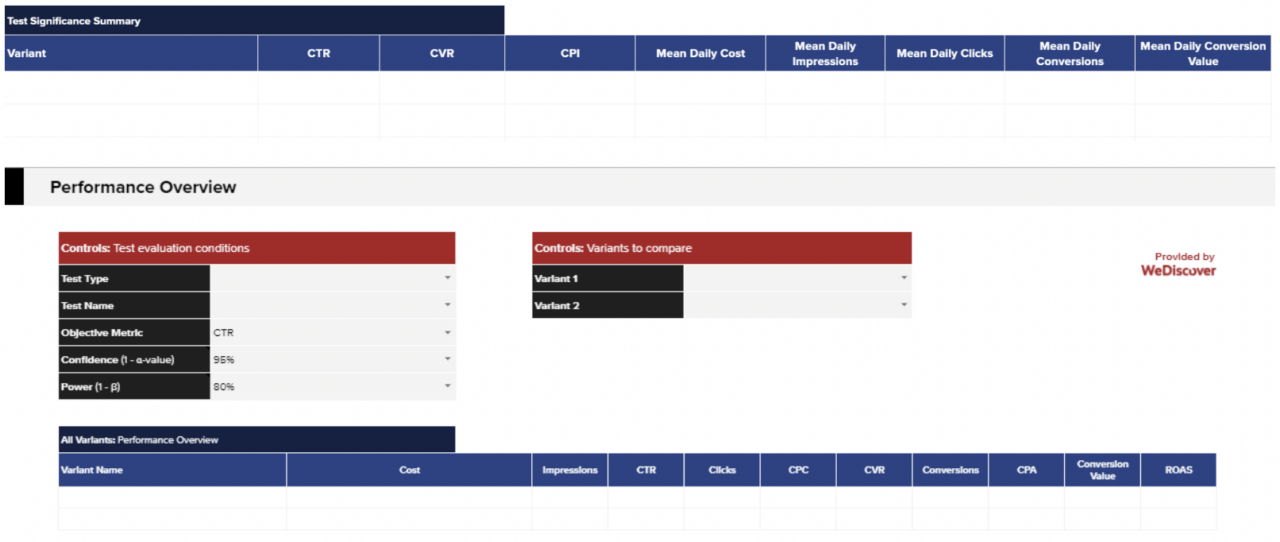
The Performance Overview section in the Drill Down tabs allows you to view a summary of all the variants in each of your tests. The sections below that explore the test results in greater detail, enabling you to make more informed, data-driven decisions about your account.
Both types of test (MVT and A/B) include calculations for statistical power and differences in variant exposure.
A power analysis allows you to determine how trustworthy your significant result is, whilst objective metric visualisations provide further context on whether it has been a fair test.
Setting up the sheet
To start, you’ll need to make a copy of this Google Sheet template and ensure you have available to you the script for the tool, hosted on Github here. You should also have open the Google Ads account that you are running your test in.
In the GSheet, open the tab titled Test Configurator, then enter the name of your test and select the test type you would like to run. You will find 3 options, each of which will require a different set-up within Google Ads:
-
- Label based testing – for when you’re using labels to compare different arms of the test, over one time period (for example: ads, ad groups or campaigns)
- Testing using Drafts & Experiments (D&E) – for when you’re using Google’s built-in Drafts & Experiments feature, over one time period
- Pre/post testing – for when you want to compare activity across two different time periods
Once you have selected an option, further fields will populate accordingly. The setup for each is outlined below.
Label tests
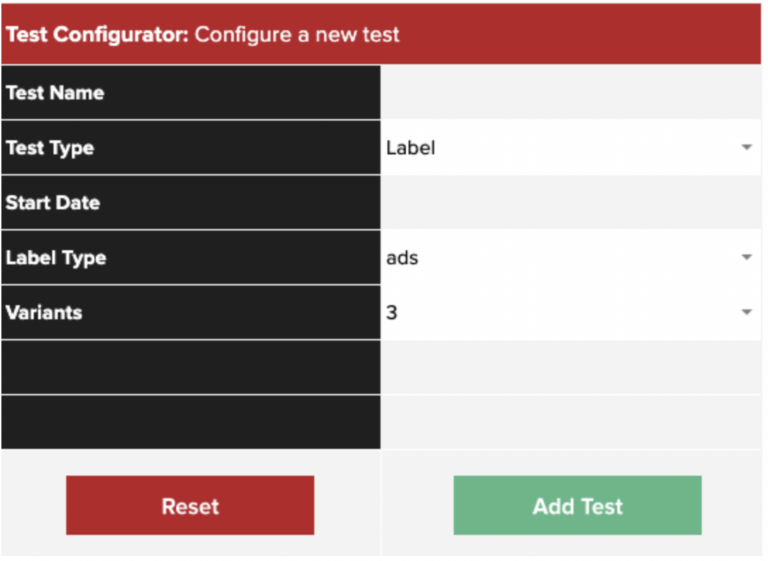
- Select Label as your Test Type
- Fill out the remaining fields. These are:
-
- Start date
- Label type i.e. whether your test is run at ad, ad group or campaign level
- The number of variants in your test (this can be any number from 2 to 6).
-
- Once you’ve clicked Add Test, navigate to the Registry: Labels tab. Here you will find your test details have auto-populated. At this point you are also able to amend the end date of the test, which by default is set to the current date. Keeping this setting will cause test measurement to run indefinitely.
- In Column E, Variant Name, you’ll be able to edit the automatically generated names to something that is easy for you to identify e.g. price based ad variant.
- Column F, the Label column, contains auto-generated labels for you to add to your variants within Google Ads. Details on how to add labels within your account can be found in this support article.
One of the most common use cases we have internally for this type of test is for ad copy. We often set up tests where we have 3 types of ad copy running across multiple ad groups and campaigns and use this tool to evaluate when one is performing significantly different than the others.
We generally recommend looking to identify the worst-performing variant (not the best), and replacing this with a new variant. By doing this, you ensure that your campaigns are gaining continuous marginal improvements over time.
Experiment (D&E) tests
The only additional input to select here after selecting your Test Type is the start date of your D&E test.
Once this has been selected, Add Test then navigate to the tab: Registry – Experiments.
Take the value automatically generated in column C, Experiment Suffix, and append it to the end of your Experiment campaign name in Google Ads.
It’s important to note some crucial points here:
- The set-up will not work if the Experiment Suffix is added to any other part of the campaign name, other than the very end
- Only edit the Experiment campaign name – the name of the original campaign should not be updated
Out of all the test types available to evaluate using the Experimentation Studio, D&Es are arguably the fairest in terms of set-up, as they allow randomisation at the cookie or impression level. We quite often use D&E of tests when trialling new bidding strategies.
Pre/post tests
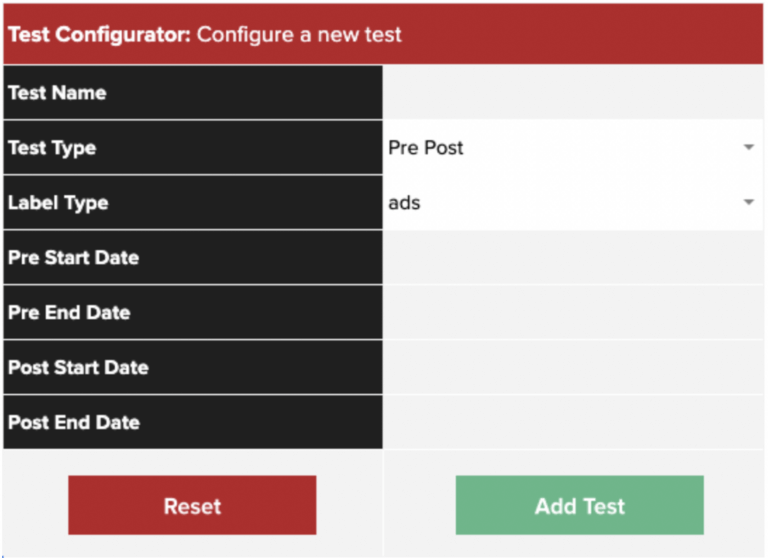
- After selecting Pre Post as your Test Type in the Test Configurator tab, select your testing entity in the Label Type row.
- Select the date ranges for each of your testing periods. You may choose different lengths of time for each period but it is important to note that this will negatively impact the fairness of your test. Further considerations to take into account are the different factors at play during the time ranges you have chosen, such as seasonality, bid or budget changes etc.
- Apply the values shown in column E, Labels, to each variant as outlined in the Label tests section above.
Because of the various factors at play here, pre-post testing is generally less favourable than label based or D&E testing, and is traditionally used when it’s not possible to test your variants concurrently. For example, if you’re changing a feature of a product where it is not possible to create a traffic split.
Setting up the script
Once test setup is complete and you have added your labels (for Label and/or Pre/Post tests) or added the Experiment Suffix to your D&E campaign name, you’re ready to put the scripts into your Google Ads account.
The script can be found here, at GitHub.
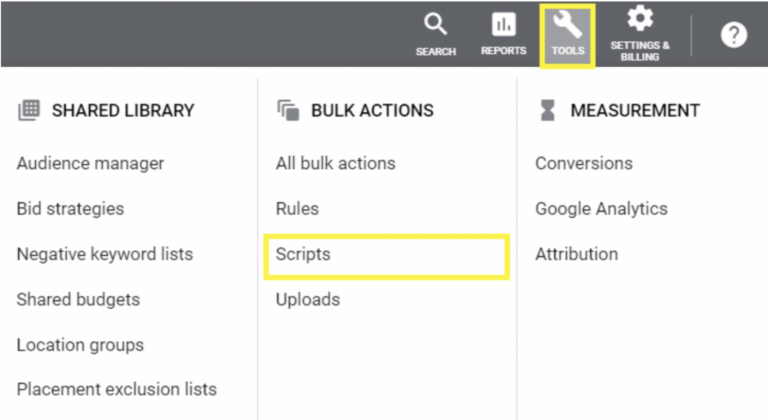
1. Sign in to your Google Ads account and click on the Tools icon at the top of the screen. In the drop-down that then opens up, under Bulk Actions select Scripts.
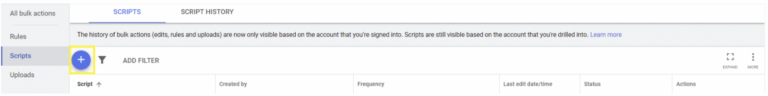
2. Click on the blue “+” icon to create a new script.
3. Delete anything that is already in the box for the script insertion in Google Ads first, then copy and paste the full script from GitHub into Google Ads.
You may choose to edit the script name at the top (highlighted red below). This will allow you to easily differentiate between the different scripts you enter.
The script is broken down into sections, with the orange text providing an explanation of what each section does.
The section that begins with “Edit Me” (highlighted yellow above) indicates that you will need to supply information there in order for the script to work.
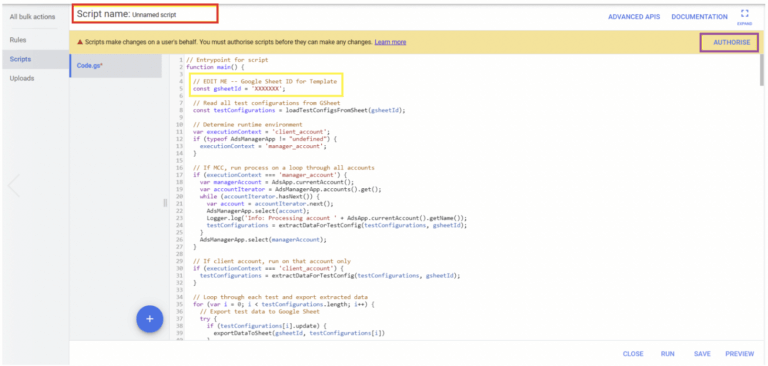
4. Supply your GSheet ID, to allow the script to collect information on the test configurations you set up earlier. This ID can be found in the URL of your GSheet. It is the value between “/d/” and “/edit”.
![]()
5. Set the script to run and authorise it when prompted, to allow it to access the account. Note that if you authorise before you run the script, you may have to repeat this when you press run. You can set the script to run at any desired frequency – our recommendation is once daily (usually first thing in the morning).
Following these steps, a query will be created to pull raw data from Google Ads, summed by either label value or campaign name appendage.
This will then be formatted for export and visible in your Gsheet, as a unique data import sheet created for each test run. The tab will be titled Data import: [test name].
Understanding your results
Now that you’re all set up, all that’s left is to view your results. This can be done across three tabs, depending on how you wish to view your data.
-
- Overview – Test Summary: provides an overview of each variant alongside commonly used metrics within Google Ads
- Drill Down – All Variants: allows you to select a visualisation metric and provides statistical analysis based on this. This displays whether your test has returned a significant result, whilst indicating whether this result is due to one variant performing statistically better or worse than all other variants in your test
- Drill Down – Two Variants: as above for the first Drill Down tab, but with a focus on comparing two particular variants in isolation against each other (that you can select). This gives you a little more control over the statistical test being carried out, and allows you to dive deeper into the results of your experiment
The top Controls section on each tab allows you to set your desired Confidence Level and Power. You are also able to filter between different tests. In its simplest terms, the higher the Confidence Level selected, the more reliable your result is. For example, having your Confidence Level se t at 99% means that 99% of results will fall within your CI, and you can be 99% sure that the difference between your variants did not occur by chance.
In the sheet you are able to choose from options for a Confidence Level of 99%, 95%, 90%, 85% and 80%. Being able to do this at the click of a button makes it easy to see how reliable your test results are and make more informed decisions about when to conclude them. The Power dropdown then sets the acceptable False Positive rate of your test, ensuring you’re aware of how trustworthy your significant result is.
All tables come with extensive notes you can hover over in the sheet, to help you understand and correctly interpret all of your results.
Considerations
While this tool will help you manage many aspects of testing in your Google Ads account, it cannot always tell you if you have a perfect set-up. Here are a few commonly seen things to be mindful of when considering how much of a “fair test” you are running:
-
- Different start/end dates for variants are possible under the sheet set up but if doing so, you cannot be entirely sure that any differences in performance are the sole result of what you are testing e.g. ad copy variation vs. other time-related performance factors.
- When using smart bidding and ads are automatically optimising to the best performing variant, as determined by Google, this can be helpful for performance but will lead to a different level of variant exposure. While this isn’t something you can control, it is important to be mindful of the relative levels of investment in each variant.
- We’ve included a daily visualisation by metric variant chart to track the relative investment in each variant you are comparing. It is worth keeping an eye on the volumes (spend, impressions, clicks, conversions, conversion volume) towards individual variants before ending a test.
And now all that’s left now is for you to start testing! See any great performance on your accounts when using this tool? Drop us an email and let us know about it at scripts@we-discover.com. You can also send any questions you have on using the tool to this address.