GeoLift Testing on Meta: a How to Guide
GeoLift Testing On Meta
The basics, how to prepare for a test, setting up a test, how to analyse & interpret results, and understanding best practices.

Share
You can run GeoLift tests on Meta to understand the incremental value of the channel.
Across the globe, CMOs and performance marketing managers are attempting to take their marketing budgets and distribute them across various performance marketing platforms to drive increased growth.
One of the core challenges faced when making growth an objective, whether short or long term, lies in understanding the incremental value of a channel. In-platform reporting – where a given media buying platform, such as Google Ads or Meta, only sees performance within its walled garden – usually doesn’t reflect reality.
Running controlled experiments, like GeoLift tests, can help to understand real performance. The results from these experiments can be used to calibrate internal attribution models, leading to improved performance insights and an understanding of how to most efficiently distribute marketing budgets, all of which ultimately drives growth.
Having run hundreds of experiments for companies of all sizes, in this article we explore the process of setting up a GeoLift test on Meta, an open souce tool available to advertisers.
Read on to learn the basics, how to prepare for a test, setting up a test, analysing and interpreting results and understanding best practices.
Key terms to be aware of
- Test group: This is the group that is exposed to the marketing campaign, selected based on specific geographic areas.
- Control group: The group that is not exposed to the marketing campaign. Selected to mirror the test group as closely as possible in terms of demographics and other key characteristics.
- Incrementality: This refers to the additional activity (this can be in the form of additional sales, clicks etc.) that can be directly attributed to a marketing campaign and that would not have been acquired without that marketing activity.
- Confounding variables: These are factors other than the marketing campaign that could influence the behaviour of the test and control groups, and should be noted as they could potentially skew the results of the experiment.
- Statistical significance: A statistical term that tells you how sure you can be that the difference between your test and control group is not due to chance.
- Seasonality: The time-based pattern or trends that reoccur some metric or observed behaviour. Understanding seasonality is important in GeoLift testing to ensure that the timing of the test does not impact the results unfairly.
Establishing Objectives for the Test
Prior to identifying test objectives, a brand should be comfortable that the tracking they have in place is robust. We recommend conducting a data availability and tracking audit prior to running any GeoLift test. We then confirm what it is we are looking to test. For example:
-
- Is Meta a new channel for the company, and therefore we want to establish relative uplift when we run activity?
- Do we want to validate or calibrate our existing measurement for activity we’re already running?
- Do we want to understand the absolute value of specific activity within the channel (Top Of Funnel/TOF vs. remarketing etc)?
- Do we want to understand how a specific change in setup — for example creatives or budget sizes — affects marginal performance?
Once that has been decided, we can start to identify the key objectives that are aligned with business goals e.g:
-
- Primary KPI: Revenue (gross or net)
- Secondary KPI: Conversion volume
Choosing your control and test markets
When deciding the optimal test and control markets to use for your analysis, you will need to:
1. Use a clean and representative dataset to conduct your initial analysis
Use recent data and ensure you have ample volume in order to be able to draw statistically significant conclusions from it. A good starting point is taking daily data from the last 6 months (you may want to exclude any anomalous periods from the analysis, such as flash sales and Christmas).
2. Understand local marketing efforts
When analysing performance, ensure you take into account any local media efforts that could skew the data e.g. TV, regional offers and offline marketing campaigns.
3. Classify the locations appropriately
Map the performance data to Commuting Zones/DMAs/GMAs (Generalised Marketing Areas). All of these concepts are geographic classifications that enable us to account for commuting distances and thus reduce the risk of spill/contamination of users between groups during our test. In this example, we use the idea of GMAs (which divide the UK into 82 unique marketing areas) for us to determine the optimal test regions & design.
Note: due to its size and unique characteristics, London (and more specifically here, GMA 1) is often excluded from targeting within GeoLift tests, as there are often no areas that can act as a fair comparison for the other arm of the experiment.
For more information on commuting zones please refer to this documentation.
4. Output interpretation
Once the optimal KPI has been selected, and the data has been cleaned (step 1), it is ready to be passed into the GeoLift tool to identify the appropriate test region(s) and interpret the associated power analysis. As part of this process, multiple different conditions needs to be defined with key inputs detailed below:
- N: list of the number of locations that could be tested – if unsure provide a large range.
- Treatment_periods: dictates different lengths of test duration that you deem appropriate for your business.
- Effect_size: the range of effect sizes you expect to observe. If you only expect a small uplift, you can define this here.
- Include_markets & exclude_markets: these are two parameters where you define regions you do or don’t want to be considered in the test. As an example, here you might want to define that GMA 1 (London) should not be considered.
- Holdout: a range of the relative size you are happy for the holdout/control region to be e.g. if you want a low risk test, you might want the holdout to be large.
- CPIC: cost per incremental conversion i.e. how much we typically need to spend on average in order to achieve one incremental conversion.
- Budget: what is your maximum total budget for a test of this nature?
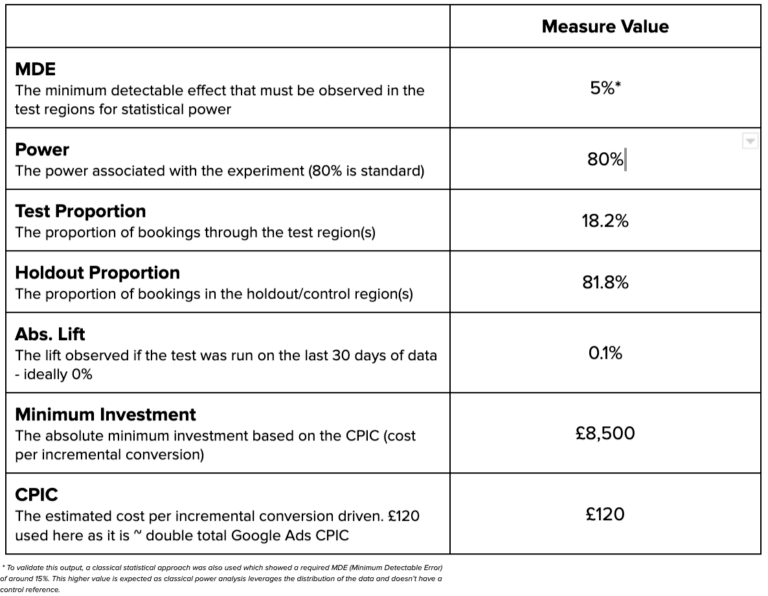
Once the above is fed into the model, a set of different simulated test designs are returned with the key information summarised as follows:
- abs_lift_in_zero (Abs. Lift): this parameter evaluates the most recent treatment_period as if it were the test. It then measures the difference between the synthetically generated control from the holdout regions vs. the achieved results from the test. Ideally you want this value to be 0%, as there should be a perfect correlation.
- Investment: the minimum budget required to achieve the results desired. This value is heavily influenced by the inputted CPIC, so if this figure is somewhat unknown it is better to overinflate the CPIC than under-estimate it.
- EffectSize: represents the minimum lift needed to have a well-powered test. In most instances, we want this to be as small as possible so we only need to observe a small change to have statistically sound outcomes.
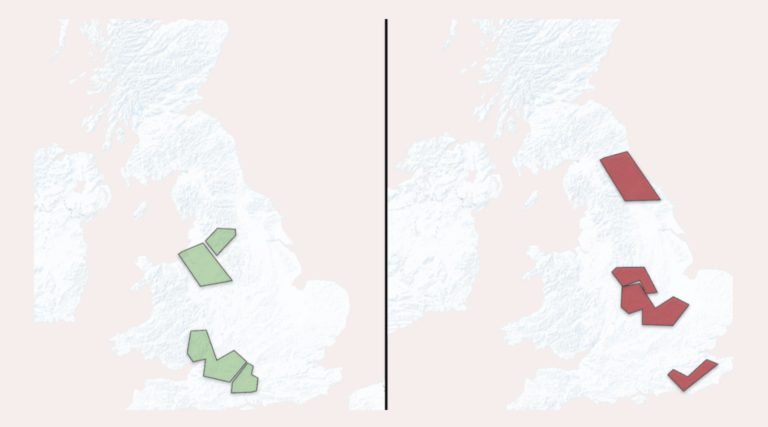
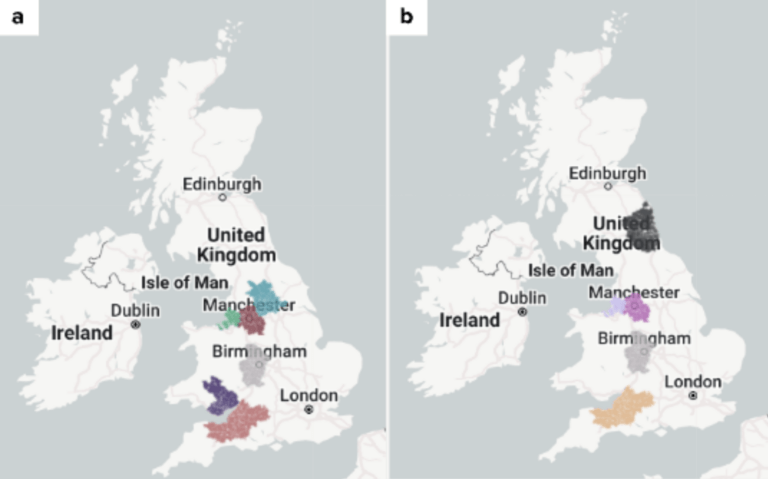
Once the optimal test design is selected the test regions to be targeted can be visualised, helping to ensure a fair geographic distribution. For example, we may realise we do not want to have all our target geographies in the north of England, as it might not be an accurate reflection of the market. Two examples of potential outputs are shown below:
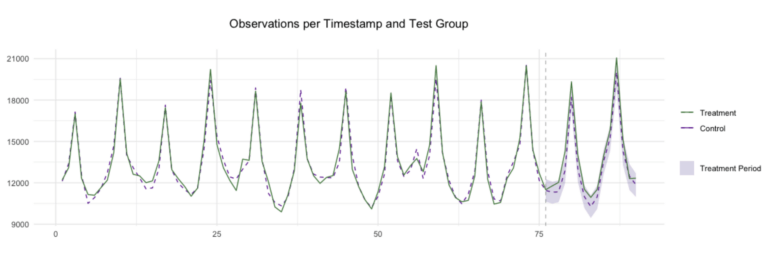
After the geo-locations are validated, you can visualise the absolute lift for the most recent treatment cycle (shown below for 30 days) to see how well the synthetic control represents the actuals. Ideally here you want the synthetic control (the dotted purple line) to perfectly mirror the actuals (solid green line).
Collating the results into a single unified view allows you to paint a picture of the testing landscape and determine whether or not the suggested test design is appropriate for the business case in hand. As an example, if you are looking to test the incremental impact of Meta using a £5,000 budget but spend £200,000 across all other paid media it is highly unlikely you’d observe an effect size of 5% based on the business landscape.
Deciding on the time frame for the test
Power analyses are often used in marketing experiments to determine the optimal sample size for a test, and from there the optimal test length, given a variety of minimum desirable effect scenarios. GeoLift operates in a somewhat similar way; enabling the user to state the optimal testing window from which simulations will then suggest the likelihood of a test being successful in the given timeline.
It’s worth noting that the ideal test length heavily depends on product and vertical, as these factors will influence factors like conversion lag. A good rule of thumb when deciding duration however is to ensure that the test period can contain at least one full purchase cycle. If the purchase cycle is not fully known, a conversion lag/maturity analysis can be run to understand and confirm the data.
Setting up a GeoLift test on Meta
The key to maximising the effectiveness of your GeoLift test can often lie in maintaining a simple and robust campaign structure. By focusing on a singular objective and minimising other variables, you create a more controlled environment for accurate measurement. This allows you to easily isolate the effects of your advertising efforts and leads to more reliable results.
Ensuring test validity
Setting clear KPIs and regularly monitoring performance metrics is crucial when conducting your test.
Adopting an iterative testing approach can also bolster validity. This would involve starting with a pilot test, analysing the data from it, and then using that to inform the approach taken on follow up tests. This helps refine your strategy and mitigates the risk of drawing incorrect conclusions.
Capitalising on Meta’s built-in experimentation tools to run parallel or A/B tests can further help to verify results, offering an additional layer of validation and ensuring that the insights gleaned are reliable.
Best practices when running GeoLift
- Aim for a test period that spans at least one complete buying cycle for the product. This should be a minimum of 15 days for shorter cycles, going up to 4-6 weeks duration where further data maturity is required.
- Obtain data at the most granular geographical level you can (i.e. postcode level).
- Gathering up to a year’s worth of historical data is the best way to capture seasonal trends and account for a range of other variables.
- When looking at performance over time utilise daily data rather than examining data at a weekly or monthly level, which can hide varying incrementality trends.
- Ensure that you have stable pre-campaign data available for at least 4-5 times the duration of the actual test. Aim to reduce the impact of confounding factors by not having made any significant account changes (bid strategy changes, structure updates etc) during either the pre test or actual testing period.
- It’s advisable but not mandatory to include panel data of covariates for enhancing the model.
- Ensure there are no missing values in the date, location, or units/KPIs for each time-location pair. Follow this guideline for any additional covariates as well.
Analysing and interpreting GeoLift test results
Analysing test vs. control performance
Using GeoLift, the pre-test approach is very similar to the post-test approach, except with new input parameters. Instead of trying to determine the optimal test regions, here we pass in the: treatment locations, treatment start & end times, and a dataset that covers all of the pre period, learning phase and test periods.
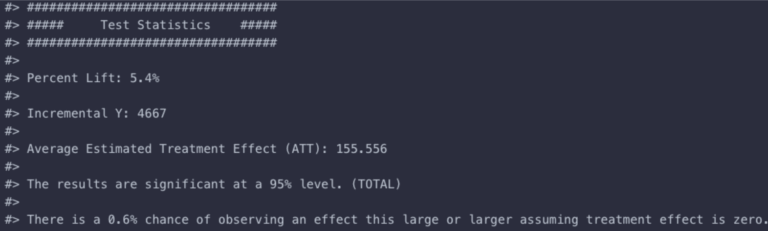
From this the package builds a synthetic control from your untreated GMAs (Generalised Marketing Areas) and then compares the test regions to this control to determine the average effect of the treatment with associated confidence:
One of the additional benefits of GeoLift is its ability to improve the model fit even further and reduce bias. There are several options for augmentation of the standard GeoLift model such as regularisation and an application of a Generalised Synthetic Control Model (GSC).
While each of these approaches provides its own set of advantages – for instance Ridge regularisation usually performs well when the number of units and time-periods aren’t large, while GSC helps improve fit for situations with many pre-treatment periods – GeoLift offers the option to let the model decide which is the best approach by setting the model parameter to “best”.
Conclusions
Running a GeoLift test on Meta is an indispensable strategy for marketing leads seeking data-driven insights.
It offers a robust framework for evaluating the true ROI of your campaigns, fine-tuning targeting mechanisms, and scaling success. A GeoLift test demystifies the impact of your advertising spend, enabling informed decision-making, and ultimately driving better business outcomes.
If you’re serious about optimising your Meta ad performance, a GeoLift test is not just an option; it’s a necessity.
For more information, feel free to reach out to us via our contact form and we would be happy to answer any questions you may have. For more information regarding GeoLift, you can visit the open source guide from Meta.