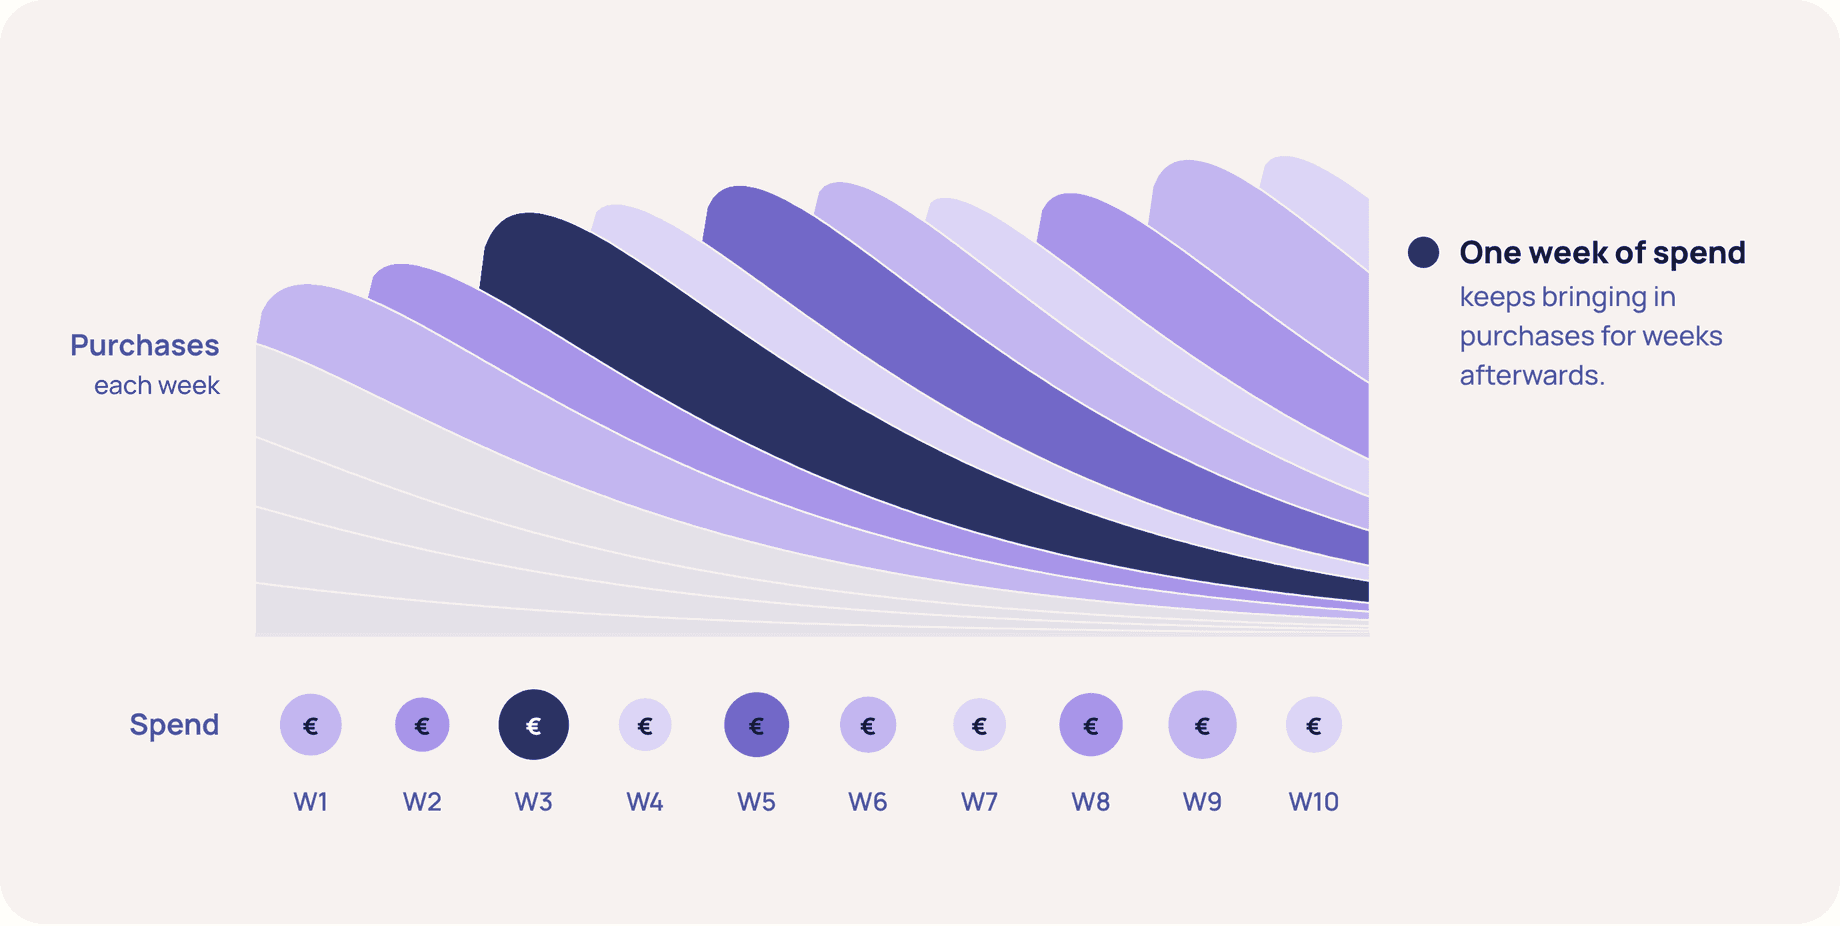
If you work in marketing, growth or measurement, you’ve probably made peace with the trifecta. Attribution, incrementality testing and marketing mix modelling, used together, each covering for the others’ blind spots. Google has championed it for years: it calls the combination “modern measurement”, has published a playbook on how to run the three together, and built Meridian, its open-source MMM, around it. Most of the industry has followed.
And it’s a good answer. But it’s an answer to a particular kind of question.
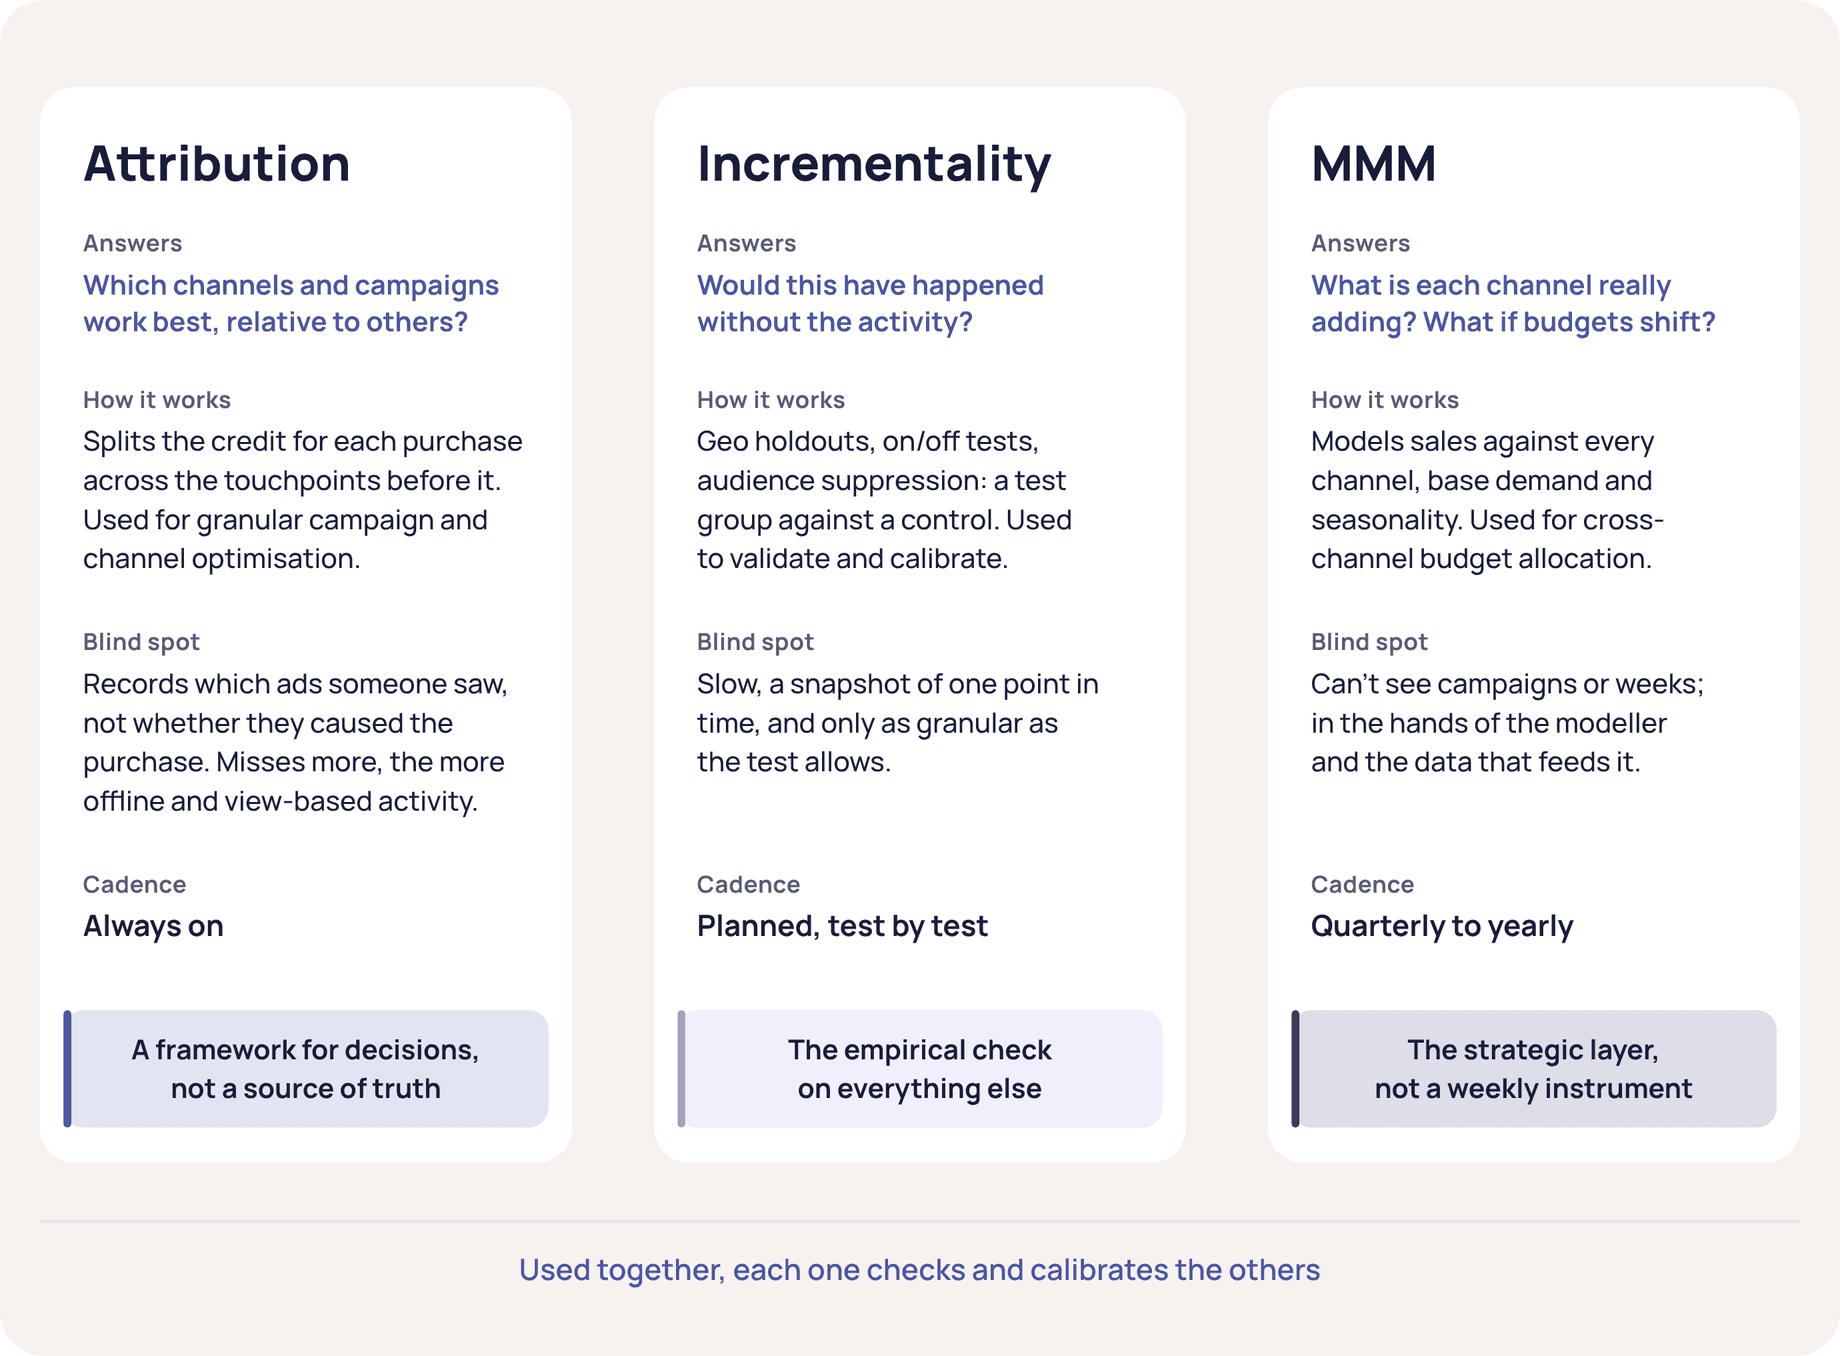
Refined, but not extended
Since it became the consensus, much of the conversation has been about how the three instruments work together. Google’s own playbook describes the journey in three stages: compare the tools side by side, then use one to calibrate another, then build an ongoing loop between them.
That’s real progress. But it’s progress within the same three instruments, answering the same kind of question. The trifecta has been refined. It hasn’t really been extended.
The key meeting marketing measurement wasn’t built for
Every Monday, in many businesses, there’s a trading meeting. Commercial, product, finance and marketing in one room, asking some version of: how did last week go, and what do we do this week?
It isn’t a marketing meeting. It’s a business meeting. The conversation is about orders, margin, conversion, prices, stock and visitors. Marketing is one input among several.
The trifecta speaks a different language. It answers marketing questions: which channel gets the credit, what spend really added, how the budget should be split. Attribution can move at weekly speed (though, as we’ll see, updating quickly isn’t the same as being complete), but it still answers “which campaign deserves credit?”, not “why was last week what it was?”. How far you can lean on it on its own also depends on your mix: the more offline, view-through and upper-funnel activity you run, the more of the picture it misses. The other two instruments are slower by design. An MMM is refreshed once or twice a year; a good test takes weeks to run and read.
So the commercial team arrives with business numbers, the marketing team arrives with marketing measurement, and the two struggle to have a productive conversation. The question in the room is a business question, and the marketing measurement instruments we’ve spent a decade refining weren’t built to answer it.
What some businesses do instead
Some businesses try to close the gap with a weekly ROAS: marketing spend this week, revenue this week, divide one by the other. It looks like a bridge between the two worlds. It isn’t, and it’s worth seeing why.
Marketing doesn’t work on a weekly clock. Picture the money spent in any given week as a wave: it sends people to the site, and some of them come back and buy days or weeks later. Every week sends out a new wave, and they overlap.
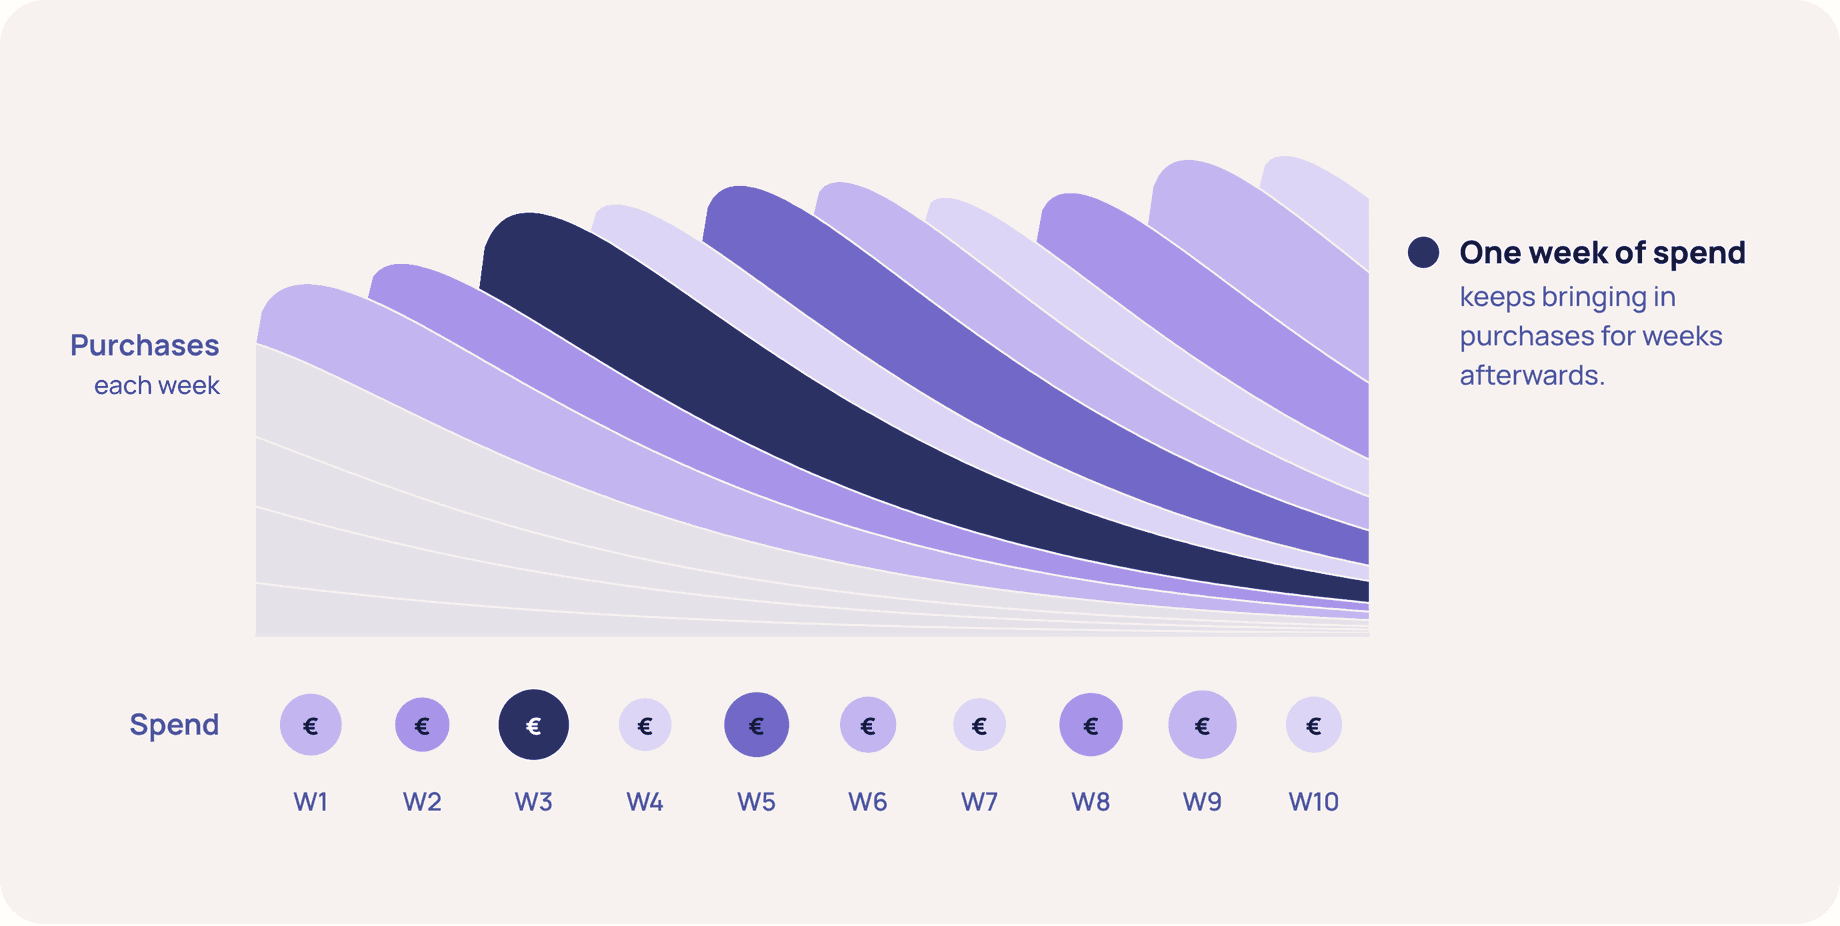
In travel, e-commerce, marketplaces and many other industries, a large share of purchases happens days or weeks after someone first arrives. People search, compare, leave and come back.
So when you take a weekly slice and divide this week’s revenue by this week’s spend, you’re mixing the tail of several old waves with the start of a new one.
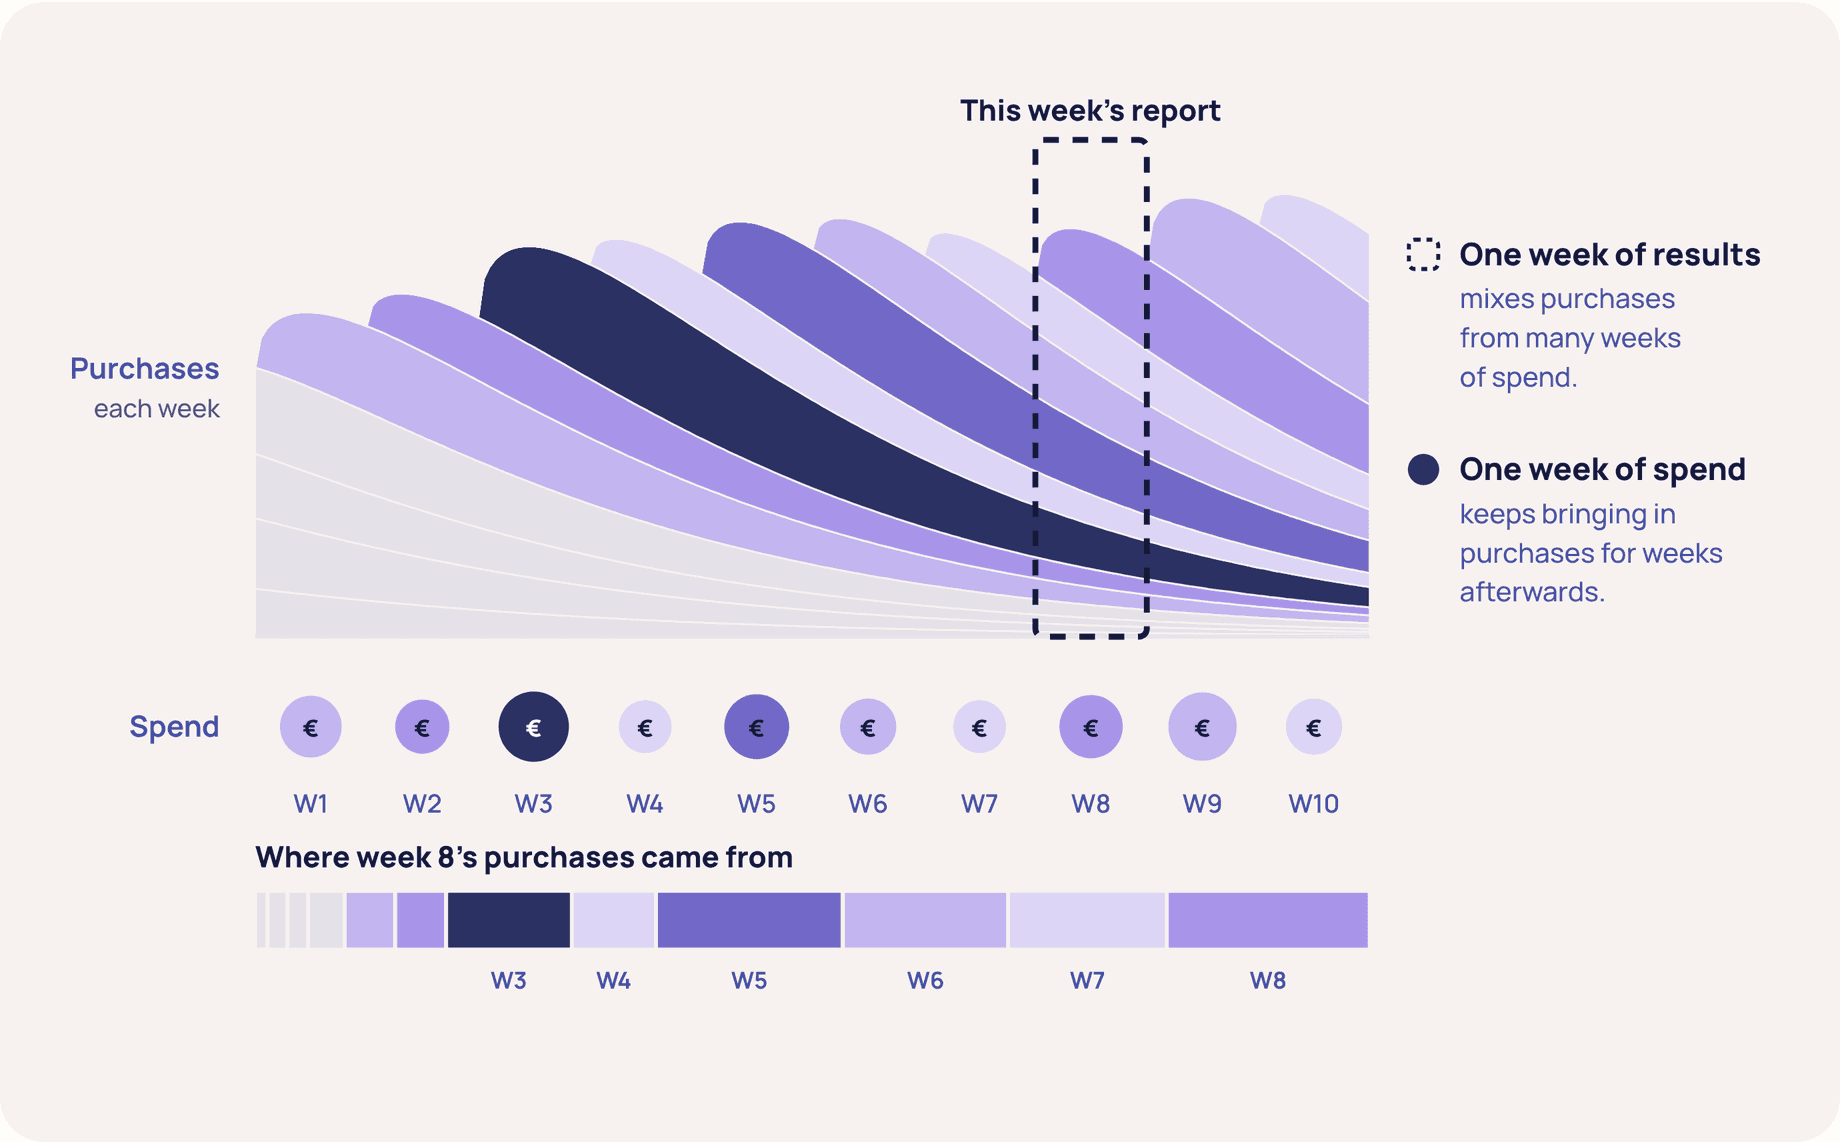
Increase spend and the weekly ROAS drops, because the new purchases haven’t arrived yet. Cut spend and it looks better, because you’re still collecting purchases from money already spent. The number moves with spend rather than with performance, and the decisions it prompts tend to be exactly the wrong ones.
This isn’t just a problem with a home-made weekly ROAS. Attribution has the same issue. Read it by purchase date, and this week’s credit is spread across many weeks of old clicks. Read it by click date, as most platforms do by default, and the most recent weeks aren’t finished yet: last week’s numbers keep rising for weeks as the tail comes in. Attribution updates daily, but it matures slowly.
That’s not a failure of the trifecta. It’s a job the trifecta was never given.
Measuring fast and slow
Daniel Kahneman’s Thinking, Fast and Slow describes two systems of thought. A fast one that’s automatic and intuitive, and gets most everyday decisions right. And a slow one that’s deliberate and effortful, which we use far less than we think, and which is there to check the fast one when it matters.
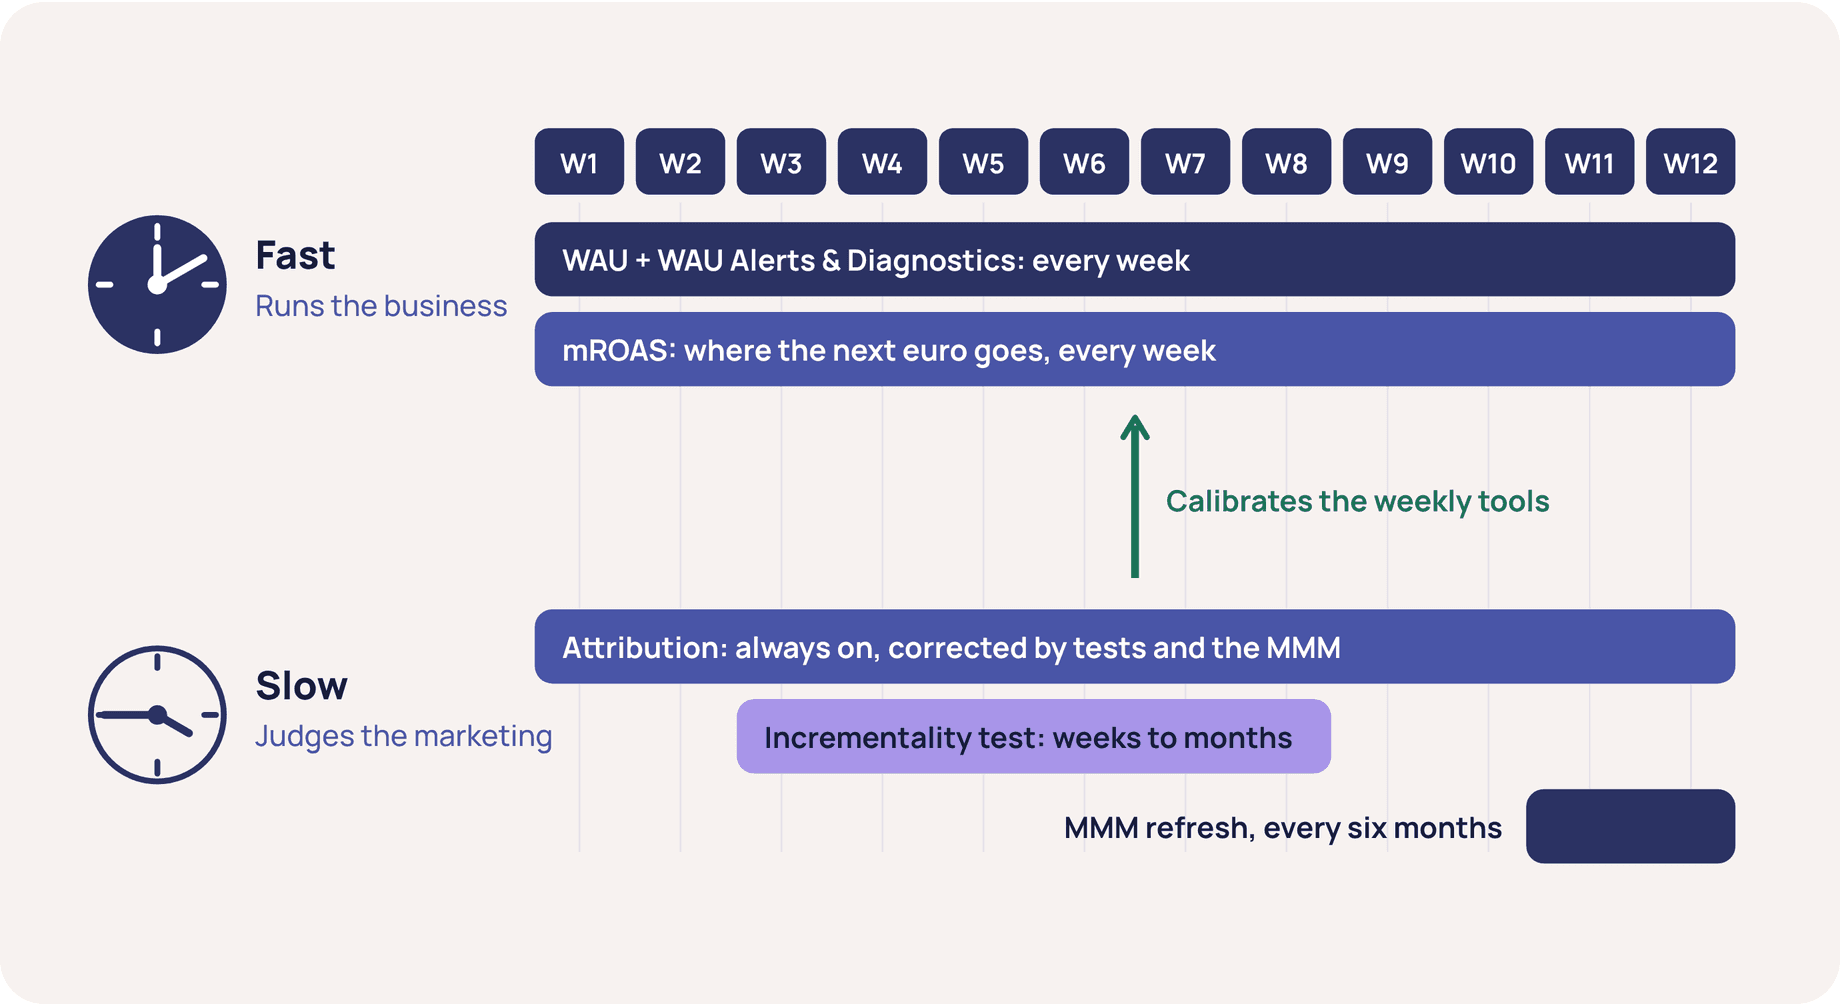
Measurement needs the same two systems. The slow one is the trifecta, and it judges the marketing. The fast one reads the business every week, in a language the whole trading meeting shares, and it needs three elements of its own: a weekly read of the business (WAU), a way to tell signal from noise and read what it means (WAU Alerts & Diagnostics), and a way to decide where the next pound or euro goes (marginal ROAS). Three slow, three fast.
Measuring fast
The fast system starts from the business rather than the channels. It reads the week the way the trading meeting sees it (visitors, conversion, purchases, margin), then explains it, and only then turns to spend.
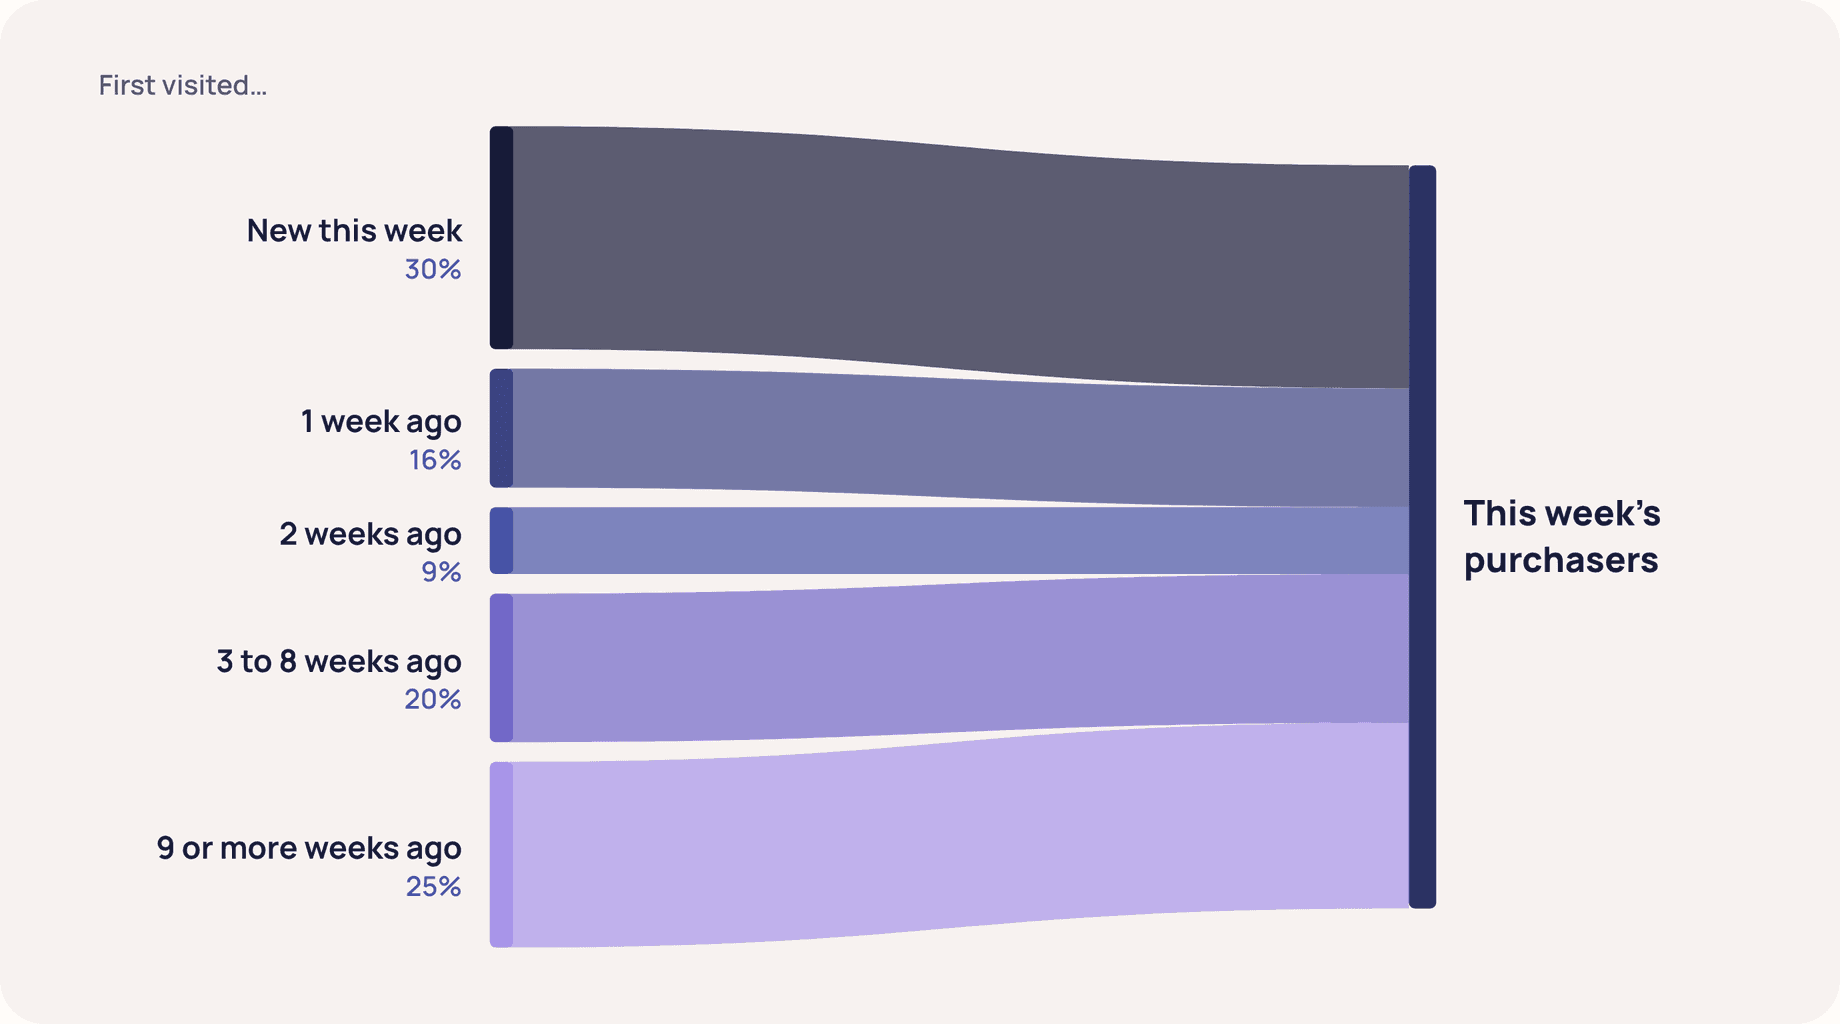
A weekly read of the business that respects how purchases actually happen. Instead of one total, split each week’s purchasers by when they first arrived: this week, last week, two weeks ago, and so on. Then track the same handful of metrics for each group: visitors, conversion, purchases, revenue and margin. You can now see whether a strong week came from fresh demand converting quickly, or from earlier weeks’ pipeline finally paying off. It uses much of the same data as attribution, but anchors each purchase on the week it happened rather than the week of the click, so it reads a complete week while still showing the waves inside it. We call this the Weekly Active Users framework, or WAU.
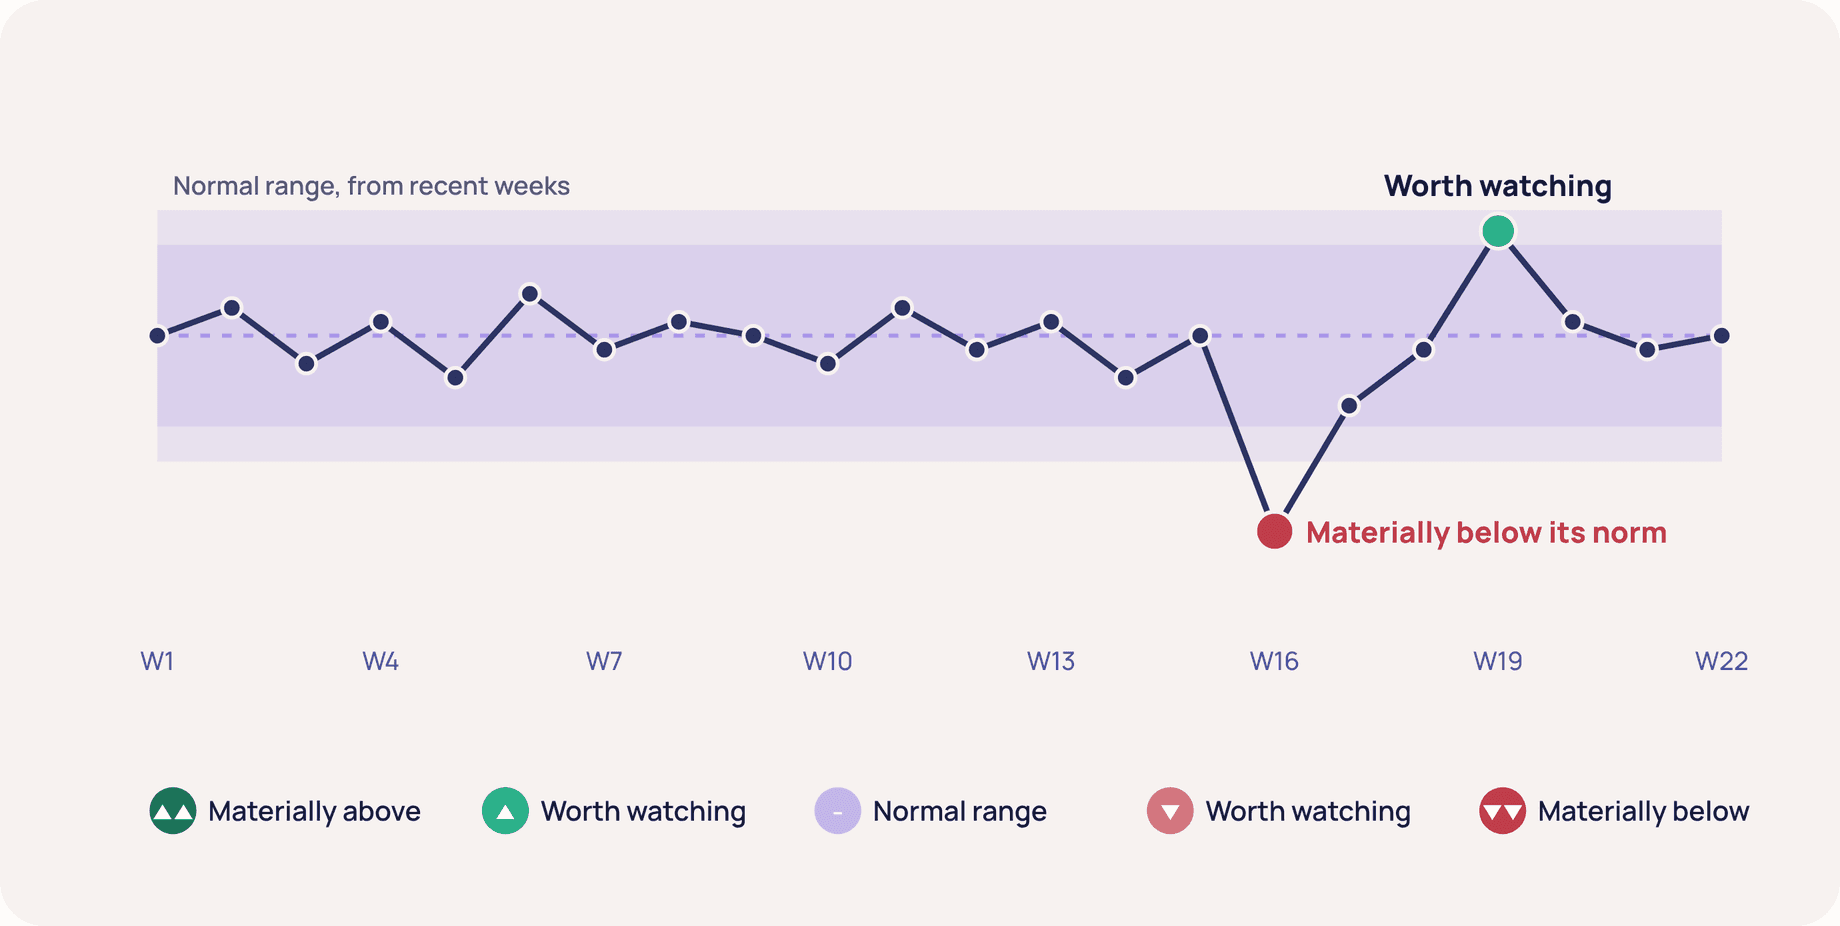
A way to tell signal from noise, and to read what it means. Weekly numbers move for all sorts of reasons. Before reacting, ask whether this week is genuinely unusual compared with its recent normal, rather than just lower than last week. We built a layer on top of WAU for this: WAU Alerts & Diagnostics. Every metric, for every group, is compared with its average and normal spread over a rolling window of recent weeks (typically 8 to 12). If this week sits outside that range with 80% confidence, it’s worth watching; with 90% confidence, it’s materially different and needs investigating. Everything else is normal variation.
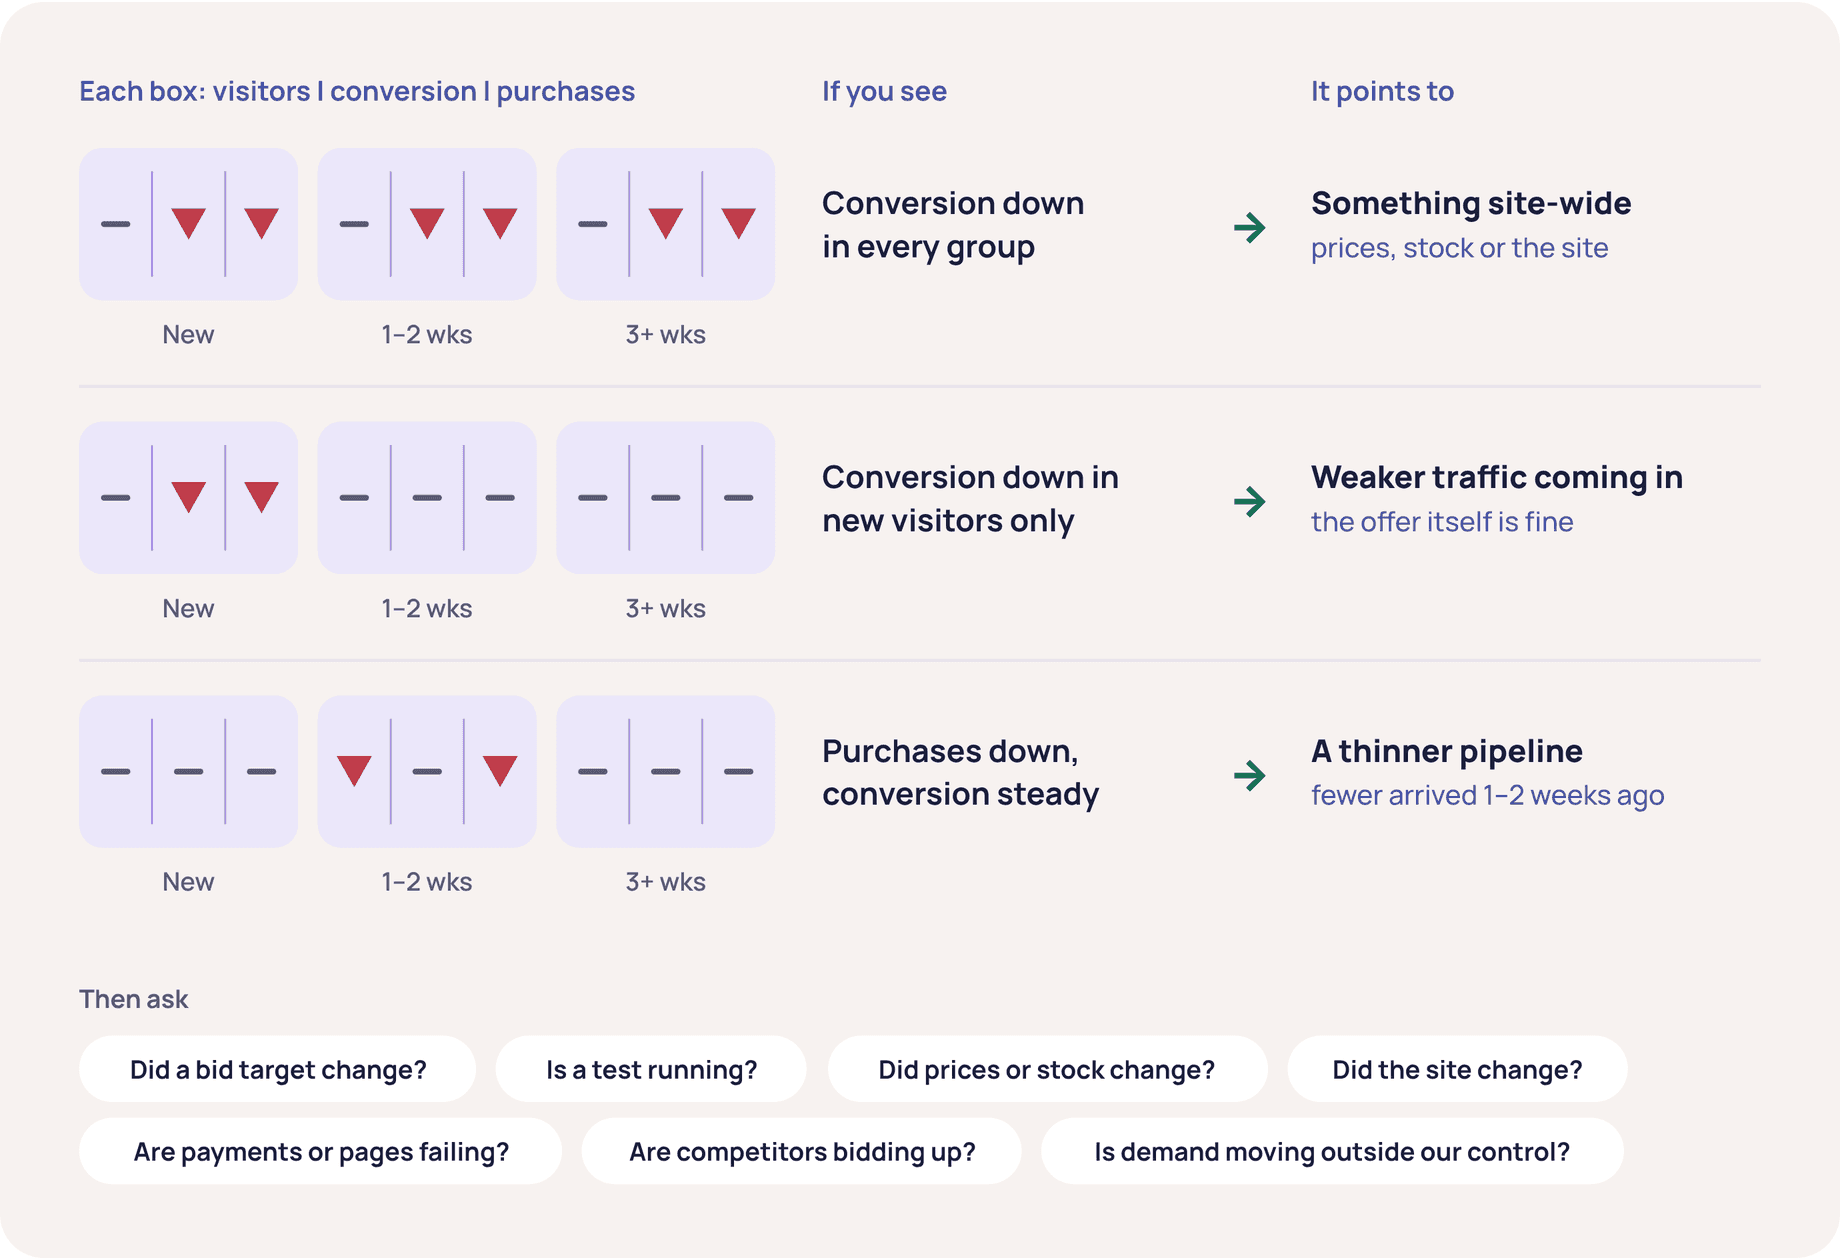
When something is flagged, comparing the WAU groups (new this week, 1 to 2 weeks ago, 3 or more weeks ago) gives a first steer on what kind of problem it is, before anyone starts digging. Conversion down for everyone points somewhere different from conversion down for new visitors only.
None of this replaces the commercial view of the business. It gives commercial and marketing teams the same picture of the week, built on purchases rather than on credit. Which still leaves one question open: given how the business is tracking against its targets, should this week’s marketing spend go up, go down, or stay where it is?
The sixth element: marginal returns
Every purchase in the trading meeting’s numbers sits at the end of a chain:
WAU and WAU Alerts & Diagnostics read the right-hand side of that chain. Marginal ROAS (mROAS) works on the left-hand side, where marketing has two levers. The first is the total spend level. The second is allocation: which campaigns get more and which get less. You can change the allocation without changing the total, and the difference in outcome can be material.
That’s what makes it the fast instrument for acting on spend. When the trading meeting concludes “we’re running behind and need more purchases” or “we’re ahead and don’t need to spend as much this week”, mROAS tells you which campaigns should have their budgets or targets raised, and which should be pulled back. We build it from Google Ads’ own bid simulations, so it needs no new data, no model refresh and no waiting for a test to finish. It can be used this week. (I went through how in a talk at PPC Live.)
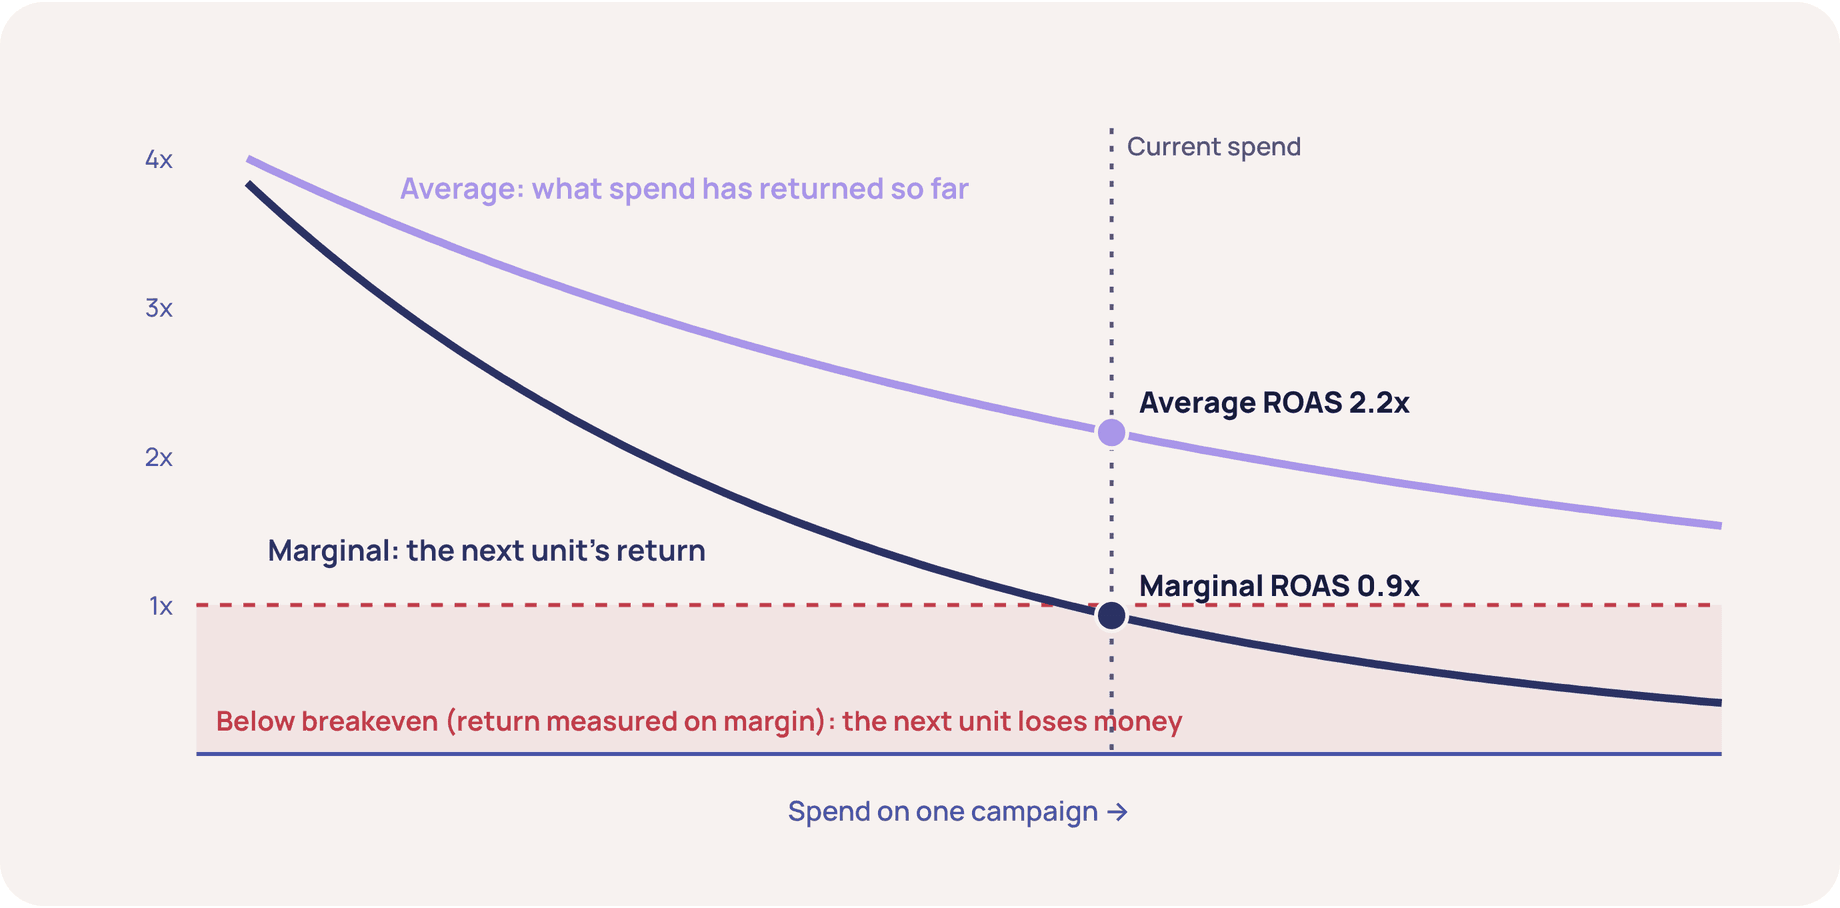
It also works as a guardrail. Even when the business needs more purchases, more spend isn’t always the answer. If the next unit of spend on a campaign would return less than it costs, pushing that campaign harder just buys purchases at a loss.

And if most campaigns look like this one, the honest answer may be that spend can’t profitably go up at all this week, even though ROAS still looks healthy on average.
And it challenges how the trifecta is usually reported. Most of the conversation, from platform dashboards to MMM read-outs to test results, still leads with an average: total return divided by total spend. Averages tell you how spend has done. They don’t tell you what the next unit will do, and two campaigns with the same average ROAS can have completely different headroom. A campaign can look healthy on average while its marginal return has already dropped below breakeven. Budget decisions are always decisions about the next unit, so they should be made on marginal returns.
Measuring slow
The slow system is the trifecta, doing what it’s best at: attribution as the always-on view of channels and campaigns, incrementality tests as causal proof, and the MMM as the strategic read on how budget should split across channels. Its job, in this picture, is to keep the fast one honest.
Why you need both
The point isn’t to replace the trifecta. It’s to give it a clearer job.
The fast tools work with what they can observe every week: spend, visitors, purchases, revenue and margin. What they can’t observe is cause. A purchase that happened is real, but whether the marketing created it, or it would have happened anyway, is invisible week to week. The same goes for the curves mROAS runs on: they come from the platform’s view of its own campaigns. Left alone, the fast system treats everything it sees as earned. The slow tools are what keep it honest. Every test result and every MMM refresh should flow back into the weekly view, adjusting the credit each channel gets and the curves mROAS runs on.
It works the other way too. The slow system sets the direction: if the MMM says invest more in TV, that should shape the plan, and a weekly read shouldn’t override it. But it’s the fast system that shows, week by week, whether the plan is landing in the business, and where to adjust along the way.
Today, most marketing teams work backwards. They start from what their channels delivered, according to their marketing measurement, and then try to match that to how the business did. It should be the other way round: start from business performance, and use marketing measurement to add colour to it. Most businesses haven’t yet found a good way to do that every week. That’s the gap WAU and WAU Alerts & Diagnostics are built to close.
That’s the shape that comes next for measurement. Two clocks: one reading the business week to week, in a language the whole trading meeting shares, and one checking, over months, that marketing is pointed in the right direction. Fast decisions, slow calibration.

