

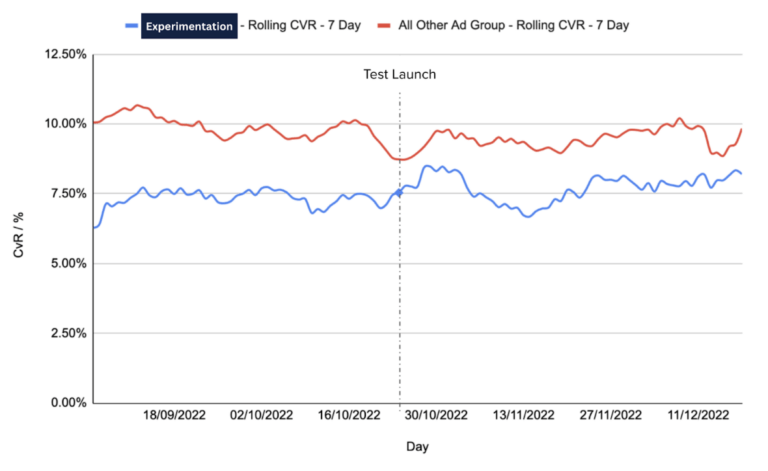
- Run a controlled A/B test to isolate if there is a statistically significant increase in performance to determine if this adjustment can justify concerns in relation to some reduction in control.
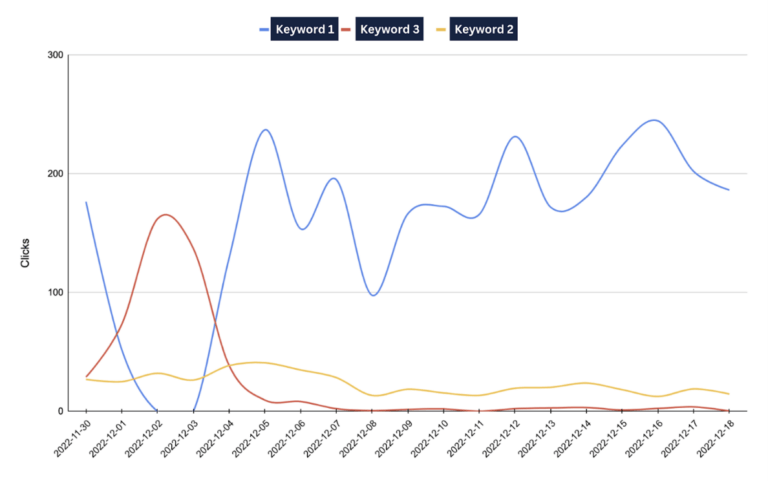
- Run a follow-up experiment centred around cross-match type keywords & the impact of matching.
- Depending on the results, look to roll out this methodology across all ad groups.
We’d love to hear what you think about our case study and what you have tried on your accounts. Contact us and share your experiences.